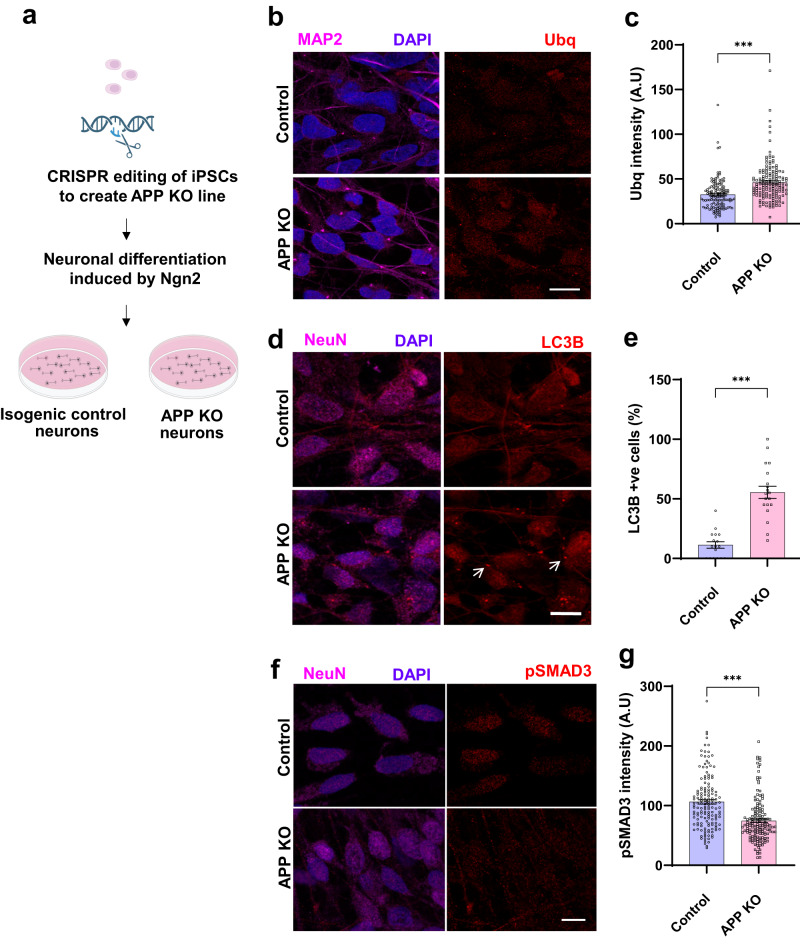
Fig. 8. Proteostasis defects in human iPSC-derived APP knockout neurons.
a Schematic of the approach to generate APP knockout and isogenic control neurons. Created with BioRender.com. b Representative immunofluorescence images show increased ubiquitin (red) immunostaining in APP knockout neurons (MAP2, magenta), additionally stained for DAPI (blue), compared to controls. c Quantitative analysis shows significantly increased ubiquitin levels in APP knockout neurons compared to controls. Control n = 133, APP KO n = 151. p-value = 8.85E-09. d Immunostaining shows increased LC3B (arrow, red) immunostaining in APP knockout neurons (NeuN, magenta) compared to controls. e Quantitative analysis shows significantly increased LC3B levels in APP knockout neurons compared to controls. Control n = 17, APP KO n = 19. p-value = 3.86E-08. f Immunostaining shows decreased phospho-SMAD3 (red) immunostaining in APP knockout neurons (NeuN, magenta) compared to controls. g Quantitative analysis shows significantly decreased phospho-SMAD3 levels in APP knockout neurons compared to controls. Control n = 150, APP KO n = 156. p-value = 9.76E-11. ***p < 0.0001, two-tailed Student’s t-test. Data are represented as mean ± SEM. Cells from 3 independent differentiations of APP knockout and isogenic control cells were analyzed. Scale bars are 10 μm. Source data are provided as a Source Data file.

