Fig. 1.
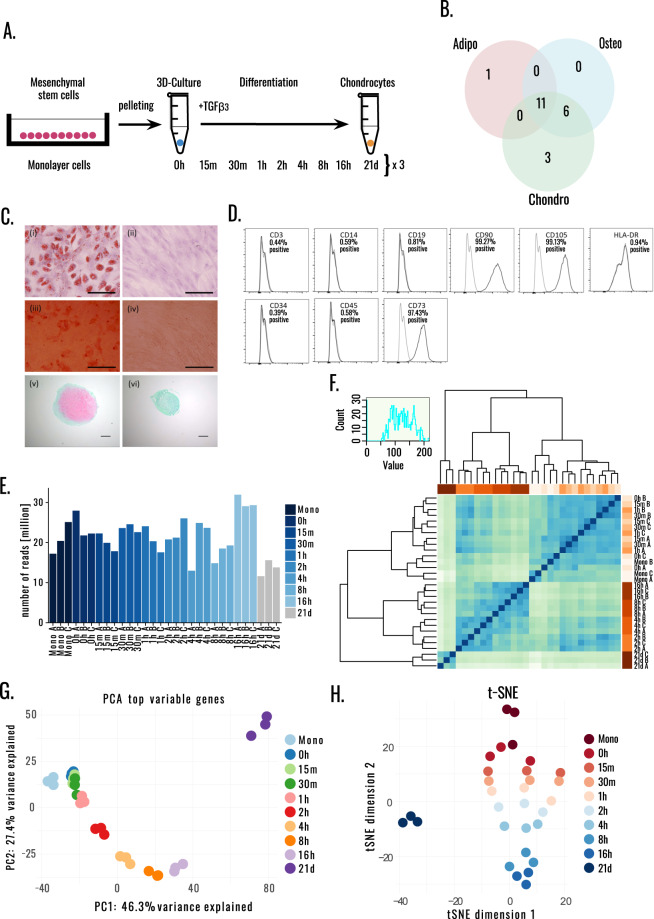
Overview and characterization of a hMSC clone with trilineage differentiation potential. (A) Overview of experimental design. Three replicates for Monolayer MSCs, undifferentiated MSCs in 3D culture (0 h) and 15 m, 30 m, 1 h, 2 h, 4 h, 8 h, 16 h after initiation of differentiation, as well as differentiated chondrocytes (21 days after initiation of differentiation). (B) Schematic of the trilineage differentiation capacity from the bone marrow derived MSC clones from a single donor. (C) The differentiation assays of the clone 1F3 selected for studying the commitment to chondrogenesis. Adipogenic differentiated (i) and control (ii) wells were stained with Oil Red O, with lipid stained vesicles present in the differentiated wells, scale bar 50μm. Osteogenic differentiated (iii) and control (iv) wells were stained with Alizarin Red, and calcium deposition was noted by positive staining in the differentiated wells, scale bar 200μm. Chondrogenic pellets were stained with Safranin O/Fast Green FCF, with positive staining for glycosaminoglycan seen in the differentiated pellets (v) compared to the control pellets (vi), scale bar 100 μM. (D) Surface profile analysis of clonal cells was carried out using flow cytometry. The clonal population was negative for CD3, CD14, CD19, CD34, CD45 and HLA-DR, but positive for the MSC markers CD73, CD90 and CD105. Isotype controls are shown in gray, and the black line represents each antigen. (E) Number or reads sequenced for each sample, for Monolayer MSCs (Mono), undifferentiated MSCs in 3D culture (0 h) and 15 m, 30 m, 1 h, 2 h, 4 h, 8 h, 16 h after initiation of differentiation, as well as differentiated chondrocytes (21 days after initiation of differentiation) replicated in three batches A, B and C. (F) Hierarchical clustering, (G) PCA plot of variance stabilized counts from top 1000 genes. (H) t-Distributed Stochastic Neighbor Embedding with perplexity 5 and max iter 5000.

