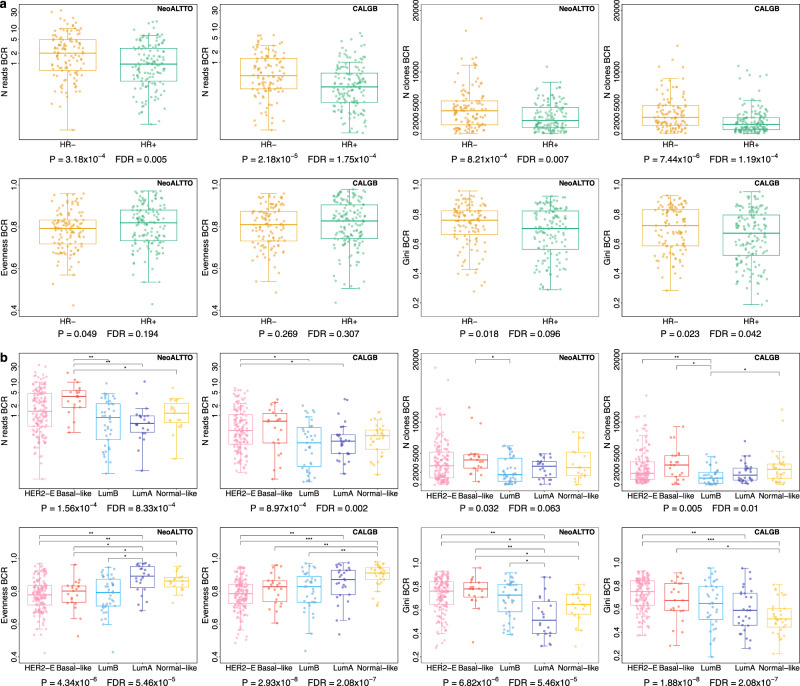
Fig. 1. Heterogeneity of BCR measures according to hormone receptor status and PAM50 subtypes.
a Comparisons of BCR normalized number of reads (“N reads”; represented on a log scale), number of clones (“N clones”), evenness and Gini index in HR- and HR+ HER2-positive breast cancer in NeoALTTO (N = 254) and CALGB 40601 (N = 264). Two-sided P values at the bottom of the panels are from Wilcoxon rank sum test, and FDRs obtained adjusting P values using Benjamini & Hochberg method. See also Supplementary Fig. 7 for the other BCR measures and Supplementary data 8 reporting P values and FDRs. b Comparisons of BCR normalized number of reads (“N reads”; represented on a log scale), number of clones (“N clones”), evenness and Gini index in PAM50 subtypes in HER2-positive breast cancer in NeoALTTO (N = 254) and CALGB 40601 (N = 264). Two-sided P values at the bottom of the panels are from Kruskal-Wallis test, while Wilcoxon rank sum test was used when comparing each group against each one of the others. FDRs were then obtained adjusting P values using Benjamini & Hochberg method. See also Supplementary Fig. 10 for the other BCR measures, Supplementary data 10, 11 reporting P values and FDRs. Source data are available. For Wilcoxon tests, FDRs < 0.05 are shown. In the panels: * = FDR < 0.05 and 0.01; ** = FDR < 0.01 and ≥ 0.001; *** = FDR < 0.001. The number of reads is normalized by the total number of reads mapping to the transcriptome in each sample, and multiplied by 1000. In boxplots, the boxes are defined by the upper and lower quartile; the median is shown as a bold colored horizontal line; whiskers extend to the most extreme data point which is no more than 1.5 times the interquartile range from the box. BCR B cell receptor, FDR false discovery rate, HER2-E HER2-Enriched, HR hormone receptor, LumA luminal A, LumB luminal B.

