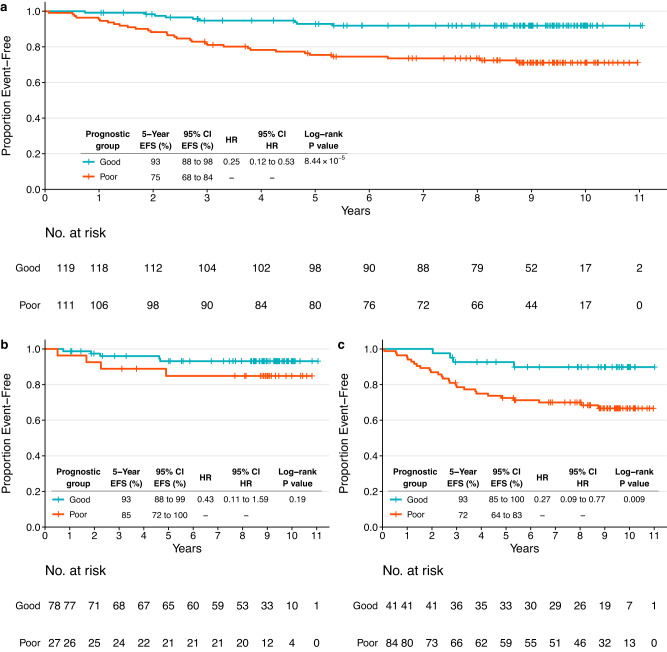
Fig. 4. Event-free survival outcomes based on the groups identified by the prognostic HER2-EveNT score in the CALGB 40601 independent validation dataset.
a Kaplan–Meier plot showing EFS in the CALGB 40601 population (N = 230) with information available for all variables included in the model (breast pCR, hormone receptor status, clinical nodal status, TILs, BCR evenness). b Kaplan–Meier plot showing EFS in the CALGB 40601 subgroup with all variables in the model available and breast pCR (ypT0/is) at surgery (N = 105). c Kaplan–Meier plot showing EFS in the CALGB 40601 subgroup with all variables in the model available and without pCR in the breast at surgery (N = 125). Patients are stratified according to low risk (good prognosis group) and high risk (poor prognosis), based on the HER2-EveNT score derived from the prognostic model. The cutoff to identify the prognostic groups is derived from NeoALTTO (patients with a score ≤ −1.3763 were assigned to the good prognosis group). Tables show 5-year EFS rates and HRs with respective 95% CI. P values are from log-rank test, HR describes the risk of an event as defined by EFS in the good prognosis group compared to the one with poor prognosis. 95% CI 95% confidence interval, BCR B cell receptor, EFS event-free survival, HR hazard ratio, pCR pathological complete response, TILs tumor-infiltrating lymphocytes.

