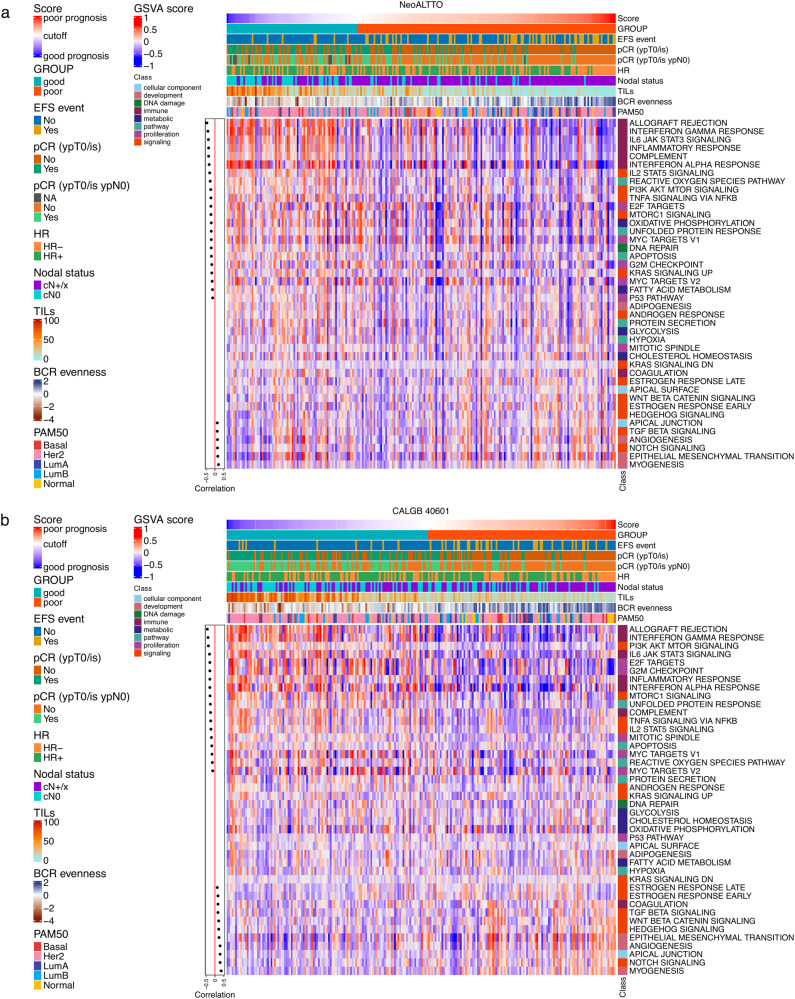
Fig. 5. Heatmap of GSVA scores for hallmark gene sets and correlations with the HER2-EveNT score in the NeoALTTO and CALGB 40601 datasets.
a Heatmap showing the GSVA scores for 42 hallmark gene sets in the NeoALTTO HER2-EveNT cohort (N = 233). b Heatmap showing the GSVA scores for 42 hallmark gene sets in the CALGB 40601 HER2-EveNT cohort (N = 230). Annotations on the top section of the heatmap include the HER2-EveNT score, the prognostic groups, presence or absence of EFS events, pCR, hormone receptor and clinical nodal status, TIL levels (%), BCR evenness (values as used in the model), and PAM50 subtypes. Cutoff represents the value to divide the two prognostic groups (−1.3763). On the left side, Spearman correlations values between the GSVA scores and the prognostic score are shown if P < 0.05 (two-sided). The red line divides positive and negative correlations. See also Supplementary data 23 and Source data. Basal basal-like, BCR B cell receptor, EFS event-free survival, GSVA gene set variation analysis, Her2 HER2-Enriched, HR hormone receptor, LumA luminal A, LumB luminal B, Normal normal-like, pCR pathological complete response.

