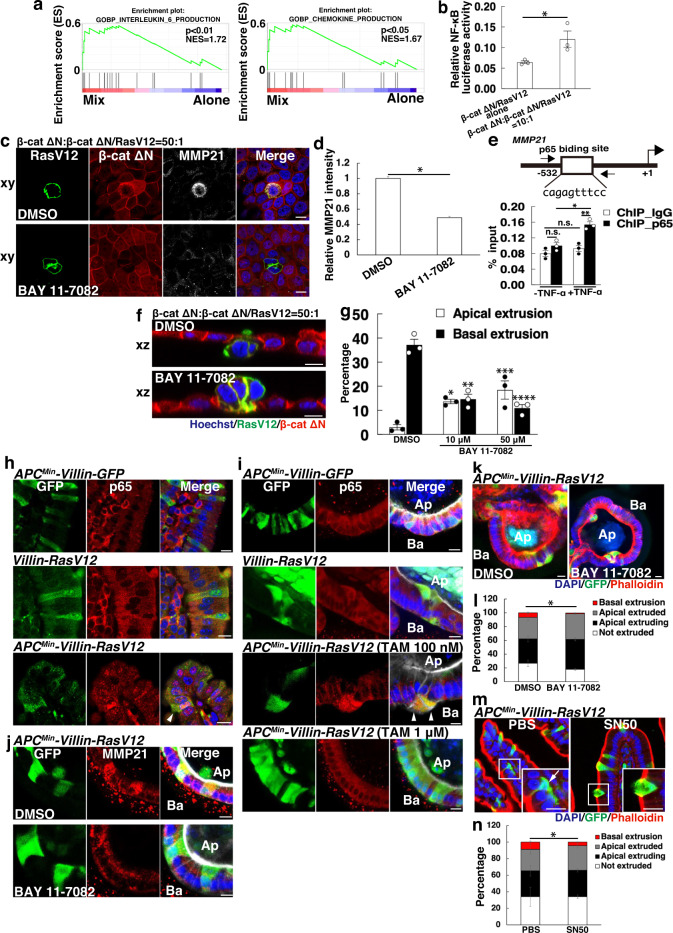
Fig. 5. NF-κB signaling governs basal extrusion of transformed cells via MMP21 upregulation.
a, b Enhanced NF-κB activity in β-cat ΔN/RasV12 cells co-cultured with β-cat ΔN cells. a GSEA plot showing a significant correlation between the transcriptional profile of β-cat ΔN/RasV12 cells co-cultured with β-cat ΔN cells and IL-6 or chemokine production gene signatures. The P-values were calculated based on a two-sided permutation test. b NF-κB reporter assay. β-cat ΔN/RasV12 cells were co-transfected with NF-κB luciferase reporter and Renilla expressing vector and were co-cultured with β-cat ΔN cells or cultured alone. Cells were then subjected to measurement of luciferase activity. Data are mean ± s.e.m. n = three independent experiments. *P = 0.0498, unpaired two-tailed t-test. c–g Effect of BAY 11-7082 on MMP21 expression and cell fates of β-cat ΔN/RasV12 cells. c Immunofluorescence images of MMP21 in the absence or presence of BAY 11-7082. β-cat ΔN/RasV12 cells were mixed with β-cat ΔN cells in the presence of BFA and were treated with DMSO or BAY 11-7082. Cells were stained with Hoechst 33342 (blue) and anti-MMP21 antibody (white). d Quantification of fluorescence intensity of MMP21. Values are expressed as a ratio relative to DMSO treatment. Data are mean ± s.e.m. *P < 0.001, unpaired two-tailed t-test; n = 418 and 420 cells pooled from three independent experiments. e p65 ChIP assay. An illustration of the p65 binding site within dog MMP21 promoter region is shown in the upper picture. Effect of TNF-α on the recruitment of p65 NF-κB to MMP21 promoter region is shown (lower panel). Data are mean ± s.e.m. n = three independent experiments. *P = 0.0069; **P = 0.0046, unpaired two-tailed t-test. f Immunofluorescence images of β-cat ΔN/RasV12 cells surrounded by β-cat ΔN cells in the absence or presence of BAY 11-7082. g Quantification of apical and basal extrusion in the absence or presence of BAY 11-7082. Data are mean ± s.e.m. n = three independent experiments. *P = 0.0018; **P = 0.0019; ***P = 0.0176; ****P = 0.0007, unpaired two-tailed t-test. h, i Activation of NF-κB signaling in APCMin/RasV12 cells. h Immunofluorescence images of p65 in intestinal villi. APCMin-Villin-GFP, Villin-RasV12, or APCMin-Villin-RasV12 mice were injected with tamoxifen and were sacrificed 3 days later. Paraffin-embedded sections were stained with DAPI (blue), anti-GFP antibody (green) and anti-p65 antibody (red). i Immunofluorescence images of p65 in intestinal organoids from indicated mice. Arrowheads indicate APCMin/RasV12-transformed cells with accumulated p65 in the nucleus (h, i). j–n Effect of NF-κB inhibition on MMP21 expression and cell fates. (j) Immunofluorescence images of MMP21 in intestinal organoids from APCMin-Villin-RasV12 mice in the absence or presence of BAY 11-7082. k Immunofluorescence images of intestinal organoids treated with 100 nM tamoxifen and cultured for 24 h in the absence or presence of BAY 11-7082. Ba and Ap stand for basal and apical sides, respectively (i–k). l Quantification of the effect of BAY 11-7082 on apical and basal extrusion ex vivo. Data are mean ± s.e.m. n = four independent experiments. *P = 0.0097 for basally extruded cells between DMSO- and BAY 11-7082-treated group, unpaired two-tailed t-test. m Immunofluorescence images of intestinal villi from APCMin-Villin-RasV12 mice administered with PBS or SN50. Magnified images depict basal (an arrow) or apical extrusion of transformed cells from PBS- or SN50-administered mice, respectively. Scale bars, 10 μm (c, f, h–k, m). n Quantification of extrusion of APCMin/RasV12-transformed cells in the absence of the presence of SN50. Data are mean ± s.e.m. n = three independent experiments. *P = 0.0486 for basally extruded cells between PBS- and SN50-administrated group, unpaired two-tailed t-test.

