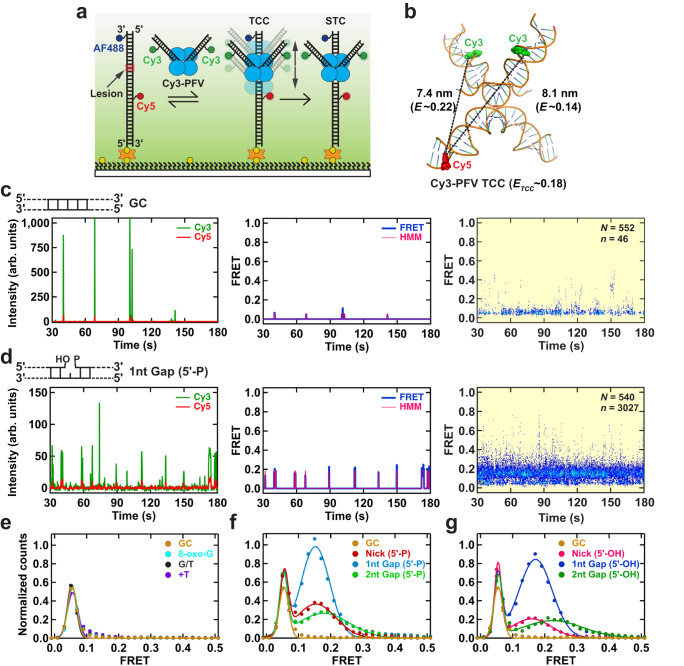
Fig. 1. Real-time PFV intasome target capture dynamics.
a An illustration of the smFRET experimental setup for visualizing the target capture by a PFV intasome labeled with Cy3 at non-transfer strands (Cy3-PFV). The intasome was introduced in real-time onto DNA targets containing AlexaFluor488 (AF488) and Cy5. b Positioning of the DNAs within the PFV TCC structure (PDB: 10.2210/pdb3os2/pdb) showing the fluorophore positions on the vDNAs (Cy3-PFV) and the target DNA (F-Cy5). The estimated inter-dye distances, corresponding FRET efficiencies, and the average FRET value (ETCC) of a mixture of molecules containing a single Cy3 on the left or right vDNA. A representative intensity trajectory (left), the corresponding FRET trajectory with the HMM fit (middle), and the post-synchronized histogram (right) displaying intasome interactions with GC duplex target DNA (c), and target DNA containing a 1nt Gap (5’-P) (d). Inset shows the total number of DNA molecules (N) analyzed for each substrate and the total number of transitions with >0.1 FRET (n). e Normalized smFRET histograms and Gaussian fits using 100 ms frame rate pseudo-FRET data (Supplementary Table 2), showing the distributions of FRET efficiency for target DNAs containing a GC duplex, 8-oxo-G lesion, G/T mismatch, +T insertion. Normalized smFRET histograms and Gaussian fits using 100 ms frame rate data (Supplementary Table 2) showing the distributions of FRET efficiency for target DNAs containing single strand scission (Nick), a 1 nt Gap, and a 2 nt Gap with a 5’-phosphate (5’-P) (f) or 5’-hydroxyl (5’-OH) (g). The GC duplex target DNA was included for comparison. Source data are provided in the Source Data File.

