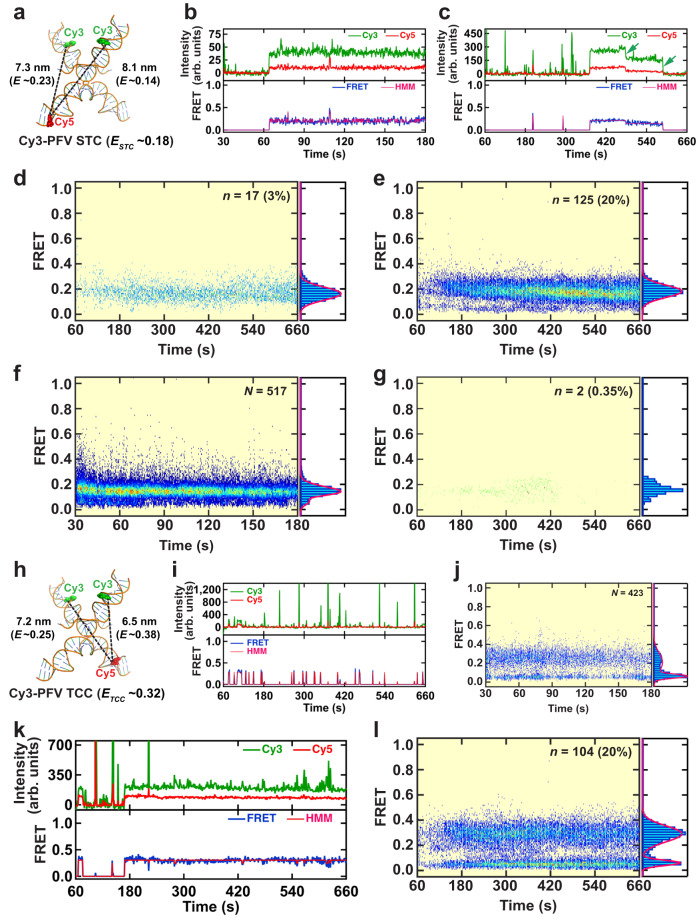
Fig. 3. Real-time PFV intasome catalyzed strand transfer.
a Illustration of the DNA configuration found in the PFV strand transfer complex (STC) crystal structure (PDB 3OS0) showing the fluorophore positions on the vDNAs (Cy3-PFV) and the target DNA (F-Cy5). The estimated inter-dye distances, corresponding FRET efficiencies, and the average FRET value (ESTC) of a mixture of molecules containing a single Cy3 on the left or right vDNA. b, c Representative intensity trajectories and corresponding FRET trajectories with HMM fits showing stable strand transfer by a Cy3-PFV intasome. Green arrows mark the photobleaching of the Cy3 FRET donor. The Post-synchronized histogram and smFRET histograms corresponding to STC events for target DNAs containing a 1nt Gap (5’-P) (d) or 1nt Gap (5’-OH) (e). The Gaussian fits to the FRET histograms are shown as red lines. Data were collected at 100 ms frame rate (b) or 1 s frame rate (c–e). Inset shows the total number of transitions with >0.1 FRET (n) and the percentage (%) of strand transfer events. The post-synchronized histogram and smFRET histograms corresponding to TCC (f) and STC (g) events for Cy3-PFV-ddA interacting with 1nt Gap (5’-OH) target DNA. Data were collected at 100 ms frame rate (f) and 1 s frame rate (g). Inset shows the total number of DNA molecules analyzed (N) (f); and the number of stable transitions with >0.1 FRET (n) and the percentage (%) of STC events (g; N = 564). h Illustration of the DNA configuration found in the PFV strand transfer complex (STC) crystal structure (PDB 3OS0) showing the fluorophore positions on the vDNAs (Cy3) and the reverse-Cy5 (R-Cy5) target DNA, respectively. The estimated inter-dye distances, corresponding FRET efficiencies, and the average FRET value (ETCC) of a mixture of molecules containing a single Cy3 on the left or right vDNA. i A representative intensity trajectory (top) and the corresponding FRET trajectory (bottom) with the HMM fit showing Cy3-PFV binding to R-Cy5 target DNA containing a 1nt Gap (5’-OH). j The post-synchronized histogram (left) and the smFRET histogram (right) produced by averaging the total number (N) of TCC smFRET traces. k A representative intensity trajectory (top) and the corresponding FRET trajectory (bottom) with HMM fit showing Cy3-PFV strand transfer into R-Cy5 target DNA containing a 1nt Gap (5’-OH). I The post-synchronized histogram (left) and the smFRET histogram (right) corresponding to the total number (n) and percentage (%) of STC events. The data in (i–l) were collected at 1 s frame rate.

