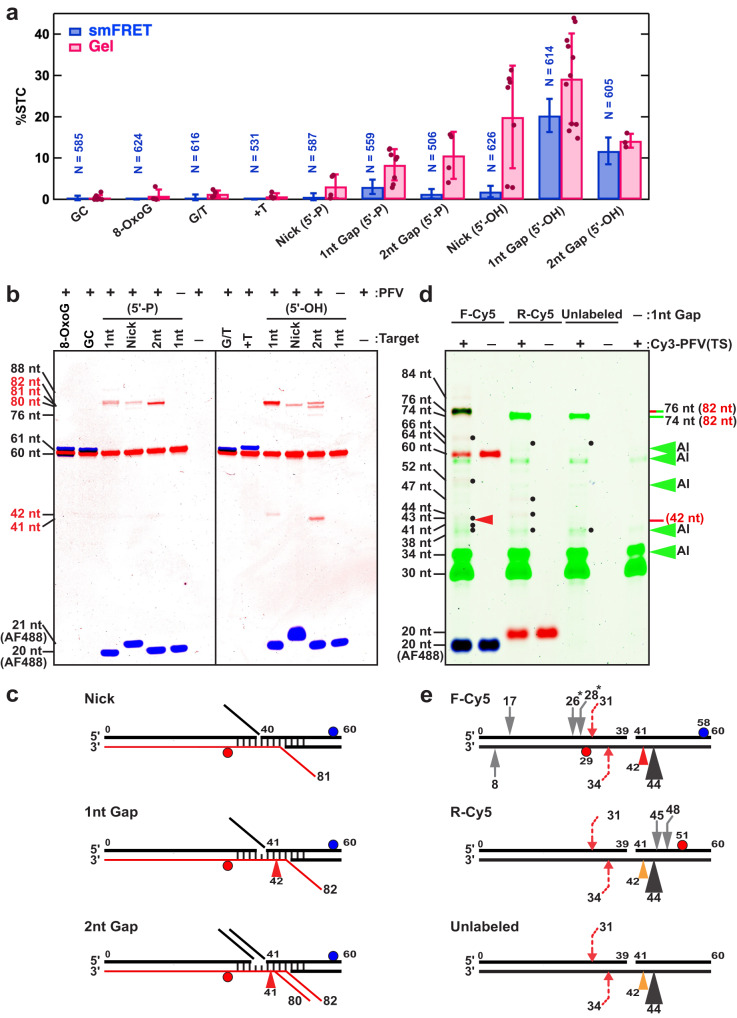
Fig. 4. Analysis of PFV strand transfer activity.
a Quantification of single-molecule FRET (smFRET) and denaturing gel electrophoresis (Gel) analysis of STC integration activity (%) on different DNA targets. Bars indicate the mean and error bars the standard of deviation of smFRET events that were observed on N molecules or from at least three independent Gel quantification analysis (see: •). The smFRET data were generated using Cy3-PFV, and the gel data were obtained using unlabeled PFV with Cy5 and AlexaFluor488 (AF488) labeled target DNAs. Error bars in the gel data are the standard deviations from triplicates. Differences in absolute frequency reflect different intasome reaction concentrations in smFRET (5 nM) and gel analysis (25 nM). b Representative denaturing PAGE gels from bulk integration studies. The lengths of ssDNAs derived from a Sanger sequencing ladder are shown. The blue and red bands show DNA fragments containing AF488 and Cy5, respectively. The target DNA substrates used for each lane are shown above (Supplementary Table 1). c Schematics showing the major strand transfer event with predicted ssDNA length (red line) and alcoholysis (red arrowhead) exhibited by unlabeled PFV intasomes. d Gel analysis (top) and integration sites (bottom) of PFV intasomes labeled with Cy3 on the vDNA transferred strand [Cy3-PFV (TS)]. Integration into different 1nt Gap (5’-OH) substrates containing a forward Cy5 label (F-Cy5), reverse Cy5 label (R-Cy5) or unlabeled as illustrated below. The blue, green and red color gel bands correspond to DNA fragments containing AF488, Cy3, and/or Cy5. The brown color bands contain both Cy3 and Cy5. Green arrows indicate location of autointegration (AI) products. The black dots indicate products resulting from strand transfer and red arrowhead the 42 nt alcoholysis product (see: b,c). Orange arrowhead in illustration represents the predicted location of an undetected alcoholysis product since the DNA strand does not contain a fluorophore label. e Calculated integration sites for each target DNA. Large black arrow indicates major (>90%) half-site integration product similar to major bands in Panel b; red dashed arrows indicate minor concerted strand transfer product; gray arrows show minor half-site products. The numbers indicate the positions of integration relative to the 5’-end of the top target DNA strand. * Indicates products that have more than one integration site solution (see text). Source data are provided in the Source Data File.

