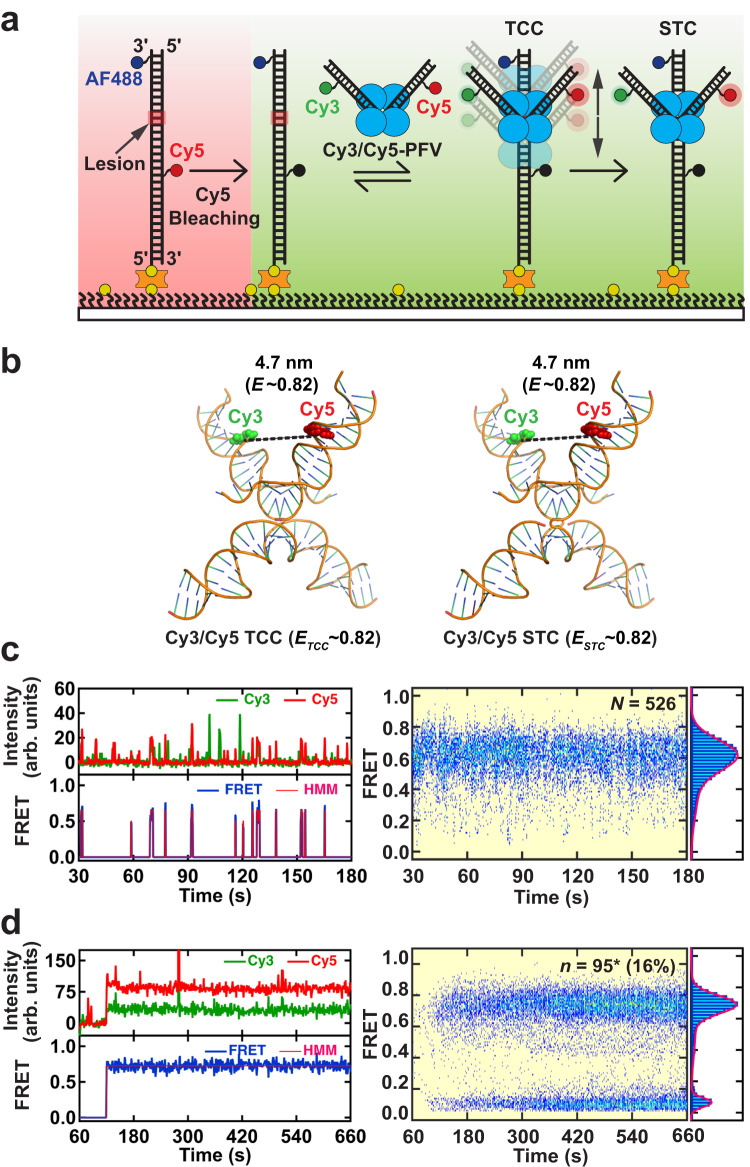
Fig. 5. Probing the structural dynamics of PFV intasome during target capture and strand transfer.
a An illustration of the smFRET experimental setup for visualizing the structural dynamics of PFV intasomes during TCC and STC formation. A PFV intasome labeled with Cy3 and Cy5 at the non-transfer strands (Cy3/Cy5 PFV) was introduced after photobleaching Cy5 on the substrates. b Illustration of the DNA configuration found in the PFV TCC structure (PDB 3OS2) and STC structure (PDB 3OS0) with the fluorophore positions on the vDNAs (Cy3 and Cy5). The estimated inter-dye distances, corresponding FRET efficiencies, and the average FRET value (ETCC and ESTC) are shown. c Left: A representative TCC intensity trajectory (top) and the resulting FRET trajectory (bottom) with the HMM fit showing Cy3/Cy5-PFV binding to a 1nt Gap (5’-OH) target DNA (left). Right: Post-synchronized histogram (left) and smFRET histogram (right) generated by averaging the total number (N) of TCC FRET traces. d Left: A representative STC intensity trajectory (top) and the resulting FRET trajectory (bottom) with HMM fit showing Cy3/Cy5-PFV integration into a 1nt Gap (5’-OH) target DNA (left). Right: Post-synchronized histogram (left) and smFRET histogram (right) generated by averaging the total number (n) of STC Cy3/Cy5-PFV FRET traces (* indicates Cy3/Cy3-PFV events are included in the total number of STC traces). The percentage (%) is the efficiency of Cy3/Cy5-PFV strand transfer that includes Cy3/Cy3-PFV bleed-through events (6%). The Gaussian fits to the histograms are shown as red lines. The TCC and STC data were collected at 1 s frame rate.

