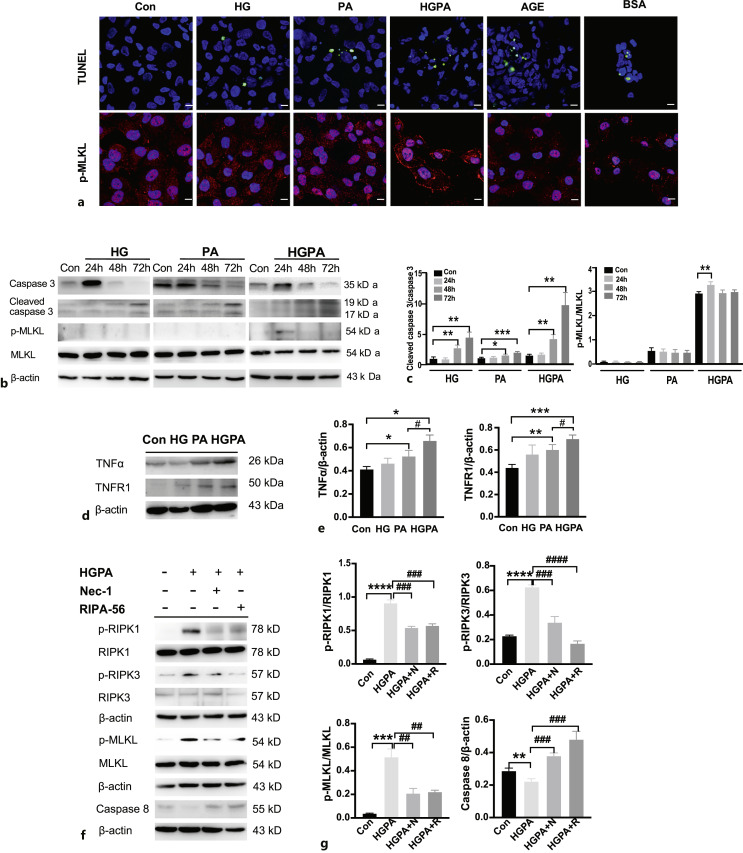
Fig. 3.
HGPA stimulated necroptosis in RTECs. a TUNEL (green) and p-MLKL (red) staining in different factors-stimulated HK2 cells. Scale bar, 10 μm. b, c Caspase-3, cleaved caspase-3, p-MLKL, MLKL levels in HG, PA, or HGPA stimulated HK2 cells for 24 h, 48 h or 72 h treatment. *p < 0.05, **p < 0.01, ***p < 0.001 compared to control (n = 3). d, e TNFα, TNFR1 levels in HG, PA or HGPA stimulated HK2 cells for 24 h treatment. *p < 0.05, **p < 0.01, ***p < 0.001 compared to control; #p < 0.05, compared to PA stimulation (n = 3). f, g HK2 cells were stimulated with HGPA, HGPA plus Nec-1 (10 μm), HGPA plus RIPA-56 (100 nm) and detected for p-RIPK1/RIPK1, p-RIPK3/RIPK3, p-MLKL/MLKL and caspase-8 expression. **p < 0.01, ***p < 0.001, ****p < 0.0001 compared to control; ##p < 0.01, ###p < 0.001, ####p < 0.0001 compared to HGPA stimulation (n = 3). Statistical significance was analyzed by two-sided Student’s t test. HG: high glucose; PA: palmitic acid; HGPA: high glucose plus palmitic acid; AGE: advanced glycation end products; BSA: bovine serum albumin.

