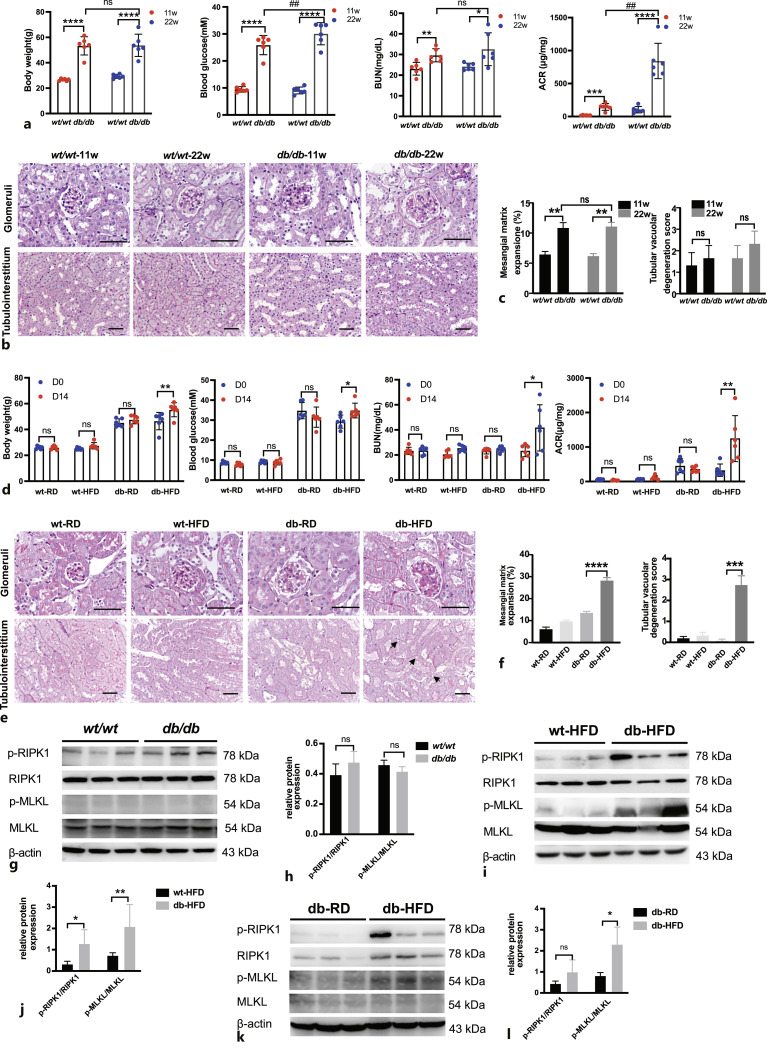
Fig. 5.
Nephropathy was developed in db/db mice fed an RD and was aggravated in db/db mice fed an HFD. a Body weight, fasting blood glucose, BUN and ACR were compared in wt/wt and db/db mice of 11 weeks old and 22 weeks old (n = 6). *p < 0.05, **p < 0.01, ****p < 0.0001 compared to wt/wt mice; ##p < 0.01 compared to db/db mice at 11 weeks old. b PAS staining of different groups of mice. Glomeruli and tubulointerstitium are displayed separately. Scale bar, 50 μm. c Statistic analysis of mesangial matrix expansion and tubular vacuolar degeneration score in different groups of mice (n = 3). **p < 0.01 compared to wt/wt mice. d Body weight, fasting blood glucose, BUN and ACR were compared in different groups of mice (n = 6). *p < 0.05, **p < 0.01 compared to db-HFD mice (D0). e PAS staining of different groups of mice. Glomeruli and tubulointerstitium are displayed separately. Black arrows indicate tubular vacuolar degeneration. Scale bar, 50 μm. f Statistic analysis of mesangial matrix expansion and tubular vacuolar degeneration score in different groups of mice. ***p < 0.001, ****p < 0.0001 compared to db-RD group. g–h Representative Western blots and statistical analysis of expression levels of p-RIPK1/RIPK1, p-MLKL/MLKL in wt/wt and db/db mouse kidneys. n = 3. ns: not significant. i–j Representative Western blots and statistical analysis of expression levels of p-RIPK1/RIPK1, p-MLKL/MLKL in wt-HFD and db-HFD mouse kidneys. n = 3. *p < 0.05, **p < 0.01 compared to wt-HFD. k–l Representative Western blots and statistical analysis of expression levels of p-RIPK1/RIPK1, p-MLKL/MLKL in db-RD and db-HFD mouse kidneys. n = 3. *p < 0.05 compared to db-RD.

