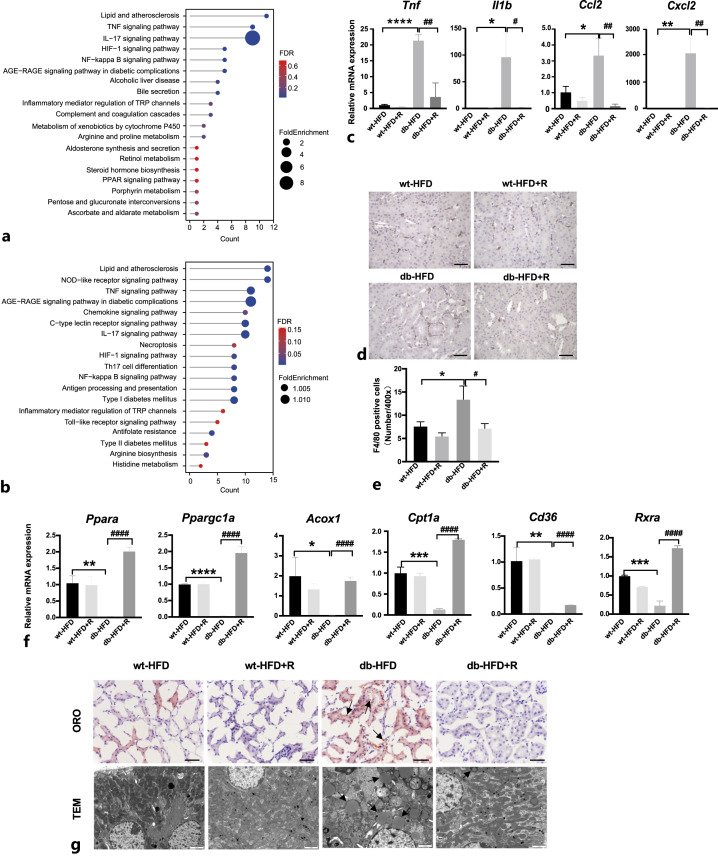
Fig. 7.
Changes of necroinflammation and lipid accumulation in db-HFD mice treated with RIPA-56 for 36 days. a The representative KEGG pathways of the upregulated DEGs in db-HFD versus wt-HFD groups. b The representative KEGG pathways of the downregulated DEGs in db-HFD+R versus db-HFD groups. c The mRNA expression of inflammatory mediators in the kidneys of the indicated groups (n = 3). *p < 0.05, **p < 0.01, ****p < 0.0001 compared to wt-HFD group; #p < 0.05, ##p < 0.01 compared to db-HFD. d Immunohistochemical staining of F4/80 in mouse kidney specimens from indicated groups. Scale bar, 50 μm. e Statistic analysis of F4/80 positive cells per ×400 field (n = 3). *p < 0.05 compared to wt-HFD group; #p < 0.05 compared to db-HFD group. f The mRNA expression of lipid metabolism related-genes in the kidneys of indicated groups (n = 3). *p < 0.05, **p < 0.01, ***p < 0.001, ****p < 0.0001 compared to wt-HFD group; ####p < 0.0001 compared to db-HFD group. g Oil red O (scale bar, 50 μm) and electron microscope (scale bar, 2 μm) images from the four indicated groups. Black arrows indicate lipid droplet accumulation. ORO: oil red O; TEM: transmission electron microscope.

