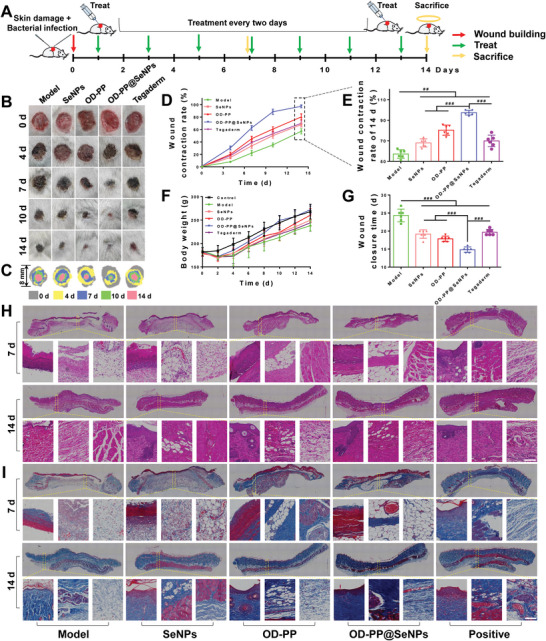
Figure 5.

In vivo evaluation of OD‐PP@SeNPs hydrogel in the infected rats wound model. A) A schematic illustration of the process and timeline of infected rats wound model. B) Macroscopic photographs of the wounds healing process with different treatments on 0, 3, 7, 10, and 14 d. C) A physical map of the wound healing process. D) Wound contraction rate during 14 d after treatment with the different preparations (n ≥ 6). E) Wound contraction rate of 14 d (n = 6). F) Body weight during 14 d after treatment with different preparations (n = 6). G) Wound closure time after treatment with the different preparations (n = 6). Histological evaluation of wound in different groups. H) H&E and I) Masson trichrome stained sections of wound tissue with different treatments at 14 d. Scale bar = 100 µm.
