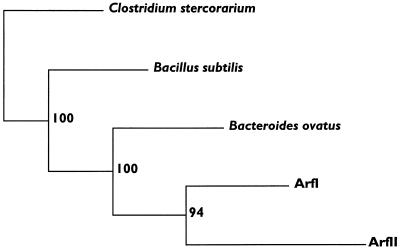
FIG. 3.
Consensus tree showing the evolutionary relationships among the sequences shown in Fig. 2. One hundred randomly sampled replications of the data set were created with SEQBOOT and were subjected to parsimony analysis with PROTPARS. A majority rule consensus tree was generated from the 100 output trees with CONSENSE. Bootstrap values that indicate the number of times that a given cluster was formed are to the right of each node. The lengths of the horizontal lines represent the relative rates of divergence. All of the programs used for this analysis were part of the PHYLIP package (2).

