
Figure 2.
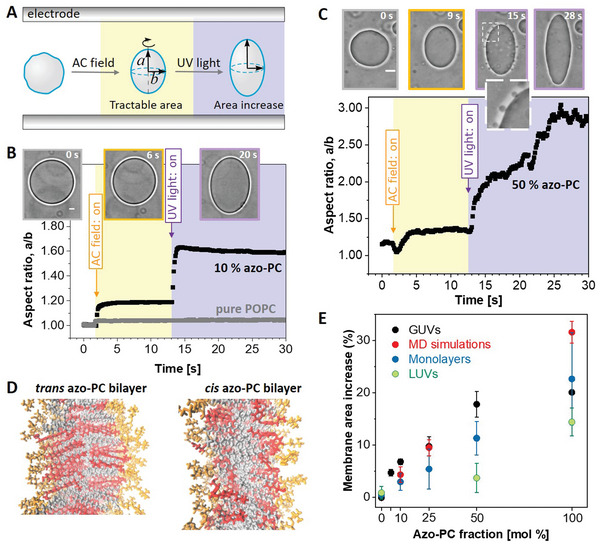
Area increase of membranes and monolayers doped with azo‐PC when exposed to UV irradiation. A) Sketch of the approach of GUV electrodeformation to assess the vesicle area change induced by UV light. The vesicles are first exposed to an AC field (5 kV m−1 and 1 MHz) to pull out thermal fluctuations and deform them into a prolate ellipsoid with semi‐axes a and b. Then, while keeping the AC field on, UV irradiation (365 nm) is initiated. B,C) Electrodeformation and irradiation of GUVs made of pure POPC (gray trace in panel B) and containing 10 and 50 mol% azo‐PC, see also Movies S4–S6 (Supporting Information) showing the response of these three vesicles. The snapshots show example images of the vesicles before applying the AC field (gray frame), after the application of the AC field (orange frame), and when exposed to UV light (purple frame). A zoomed‐up vesicle segment (dashed region) is given in C, showing the produced vesicle buds right after irradiation. The vesicle semi‐axes are used to calculate the vesicle area. Scale bars are 10 µm. D) Snapshots from MD simulations bilayers composed of 100 mol% azo‐PC in trans and cis conformation. The head groups of the lipids are in orange, the azo‐benzene moiety in red, and the oleoyl tails in gray. The area of the bilayer increases and tits thickness decreases. E) Membrane area expansion as assessed from GUV electrodeformation (black data show mean and standard deviations, SD; see Figure S3, Supporting Information, for data from individual GUV measurements), MD simulations (red), Langmuir monolayer isotherms (dark blue; see Figure S3, Supporting Information, for data from individual measurements) and LUVs measured with dynamic light scattering (DLS) (green). The LUV data is based on vesicle hydrodynamic radius leading to a systematic underestimate of the area increase as UV‐triggered morphological transitions (as those shown in panel C and Figure 1C,D) cannot be accounted for.