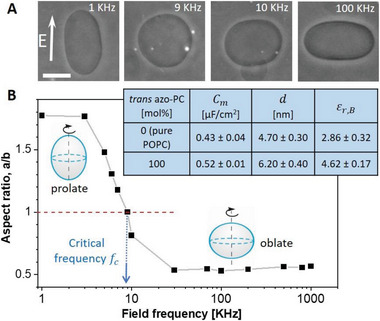
Figure 5.

Specific membrane capacitance measurements and estimates of the dielectric permittivity of 100 mol% trans azo‐PC and pure POPC membranes. A) Phase‐contrast images of a GUV exhibiting morphological prolate‐sphere‐oblate transitions under a frequency sweep at a field strength of 10 kV m−1. The scale bar is 10 µm. B) Aspect ratio versus frequency plot of the same GUV shown in (A). The critical field frequency (≈9 KHz) of the prolate‐oblate transition point with an aspect ratio a/b = 1 is indicated with an arrow. The table in the inset summarizes the specific membrane capacitance (averaged over 10 vesicles per composition), results for the mean bilayer thickness obtained from AFM (see also Figure S7, Supporting Information), and the estimated dielectric constant for pure POPC membrane and pure azo‐PC bilayer in the trans state.
