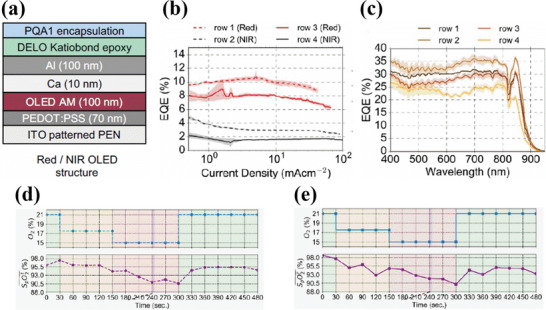
Figure 5.

a) Device structure of the red/NIR OLED. b) EQE of the NIR and red OLEDs from rows 1, 2 (dotted lines) and 3, 4 (straight lines). c) EQE of the OPDs in different rows marked with distinct colors. The average EQE is ≈30% throughout the absorption spectrum. d) SpO2 measurements from the commercial pulse oximeter where the oxygen concentration is varied from 21% to 15% and back to 21%. e) SpO2 measurements of the organic reflection probe attached to the fore head. Reproduced with permission.[ 94 ] Copyright 2018, National Academy of Sciences.
