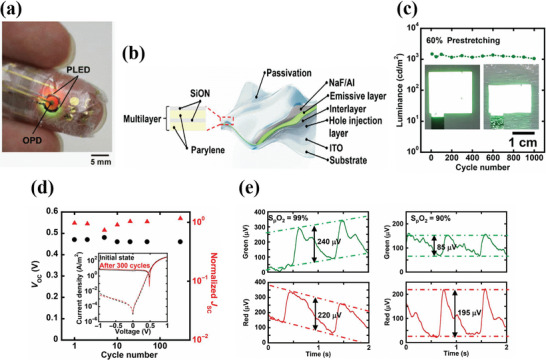
Figure 7.

a) Image of an ultra‐flexible pulse oximeter sensor attached to a finger. b) Structure of an ultra‐flexible PLED whose encapsulation consists of alternating inorganic (200‐nm‐thick SiON) and organic (500‐nm‐thick parylene) layers. c) Cyclic stretching test of the green PLED. The inset is the image of the PLED before and after the mechanical test. d) The plot of V oc versus normalized J sc with the number of stretching cycles for the OPD. The black circles and red triangles represent the V oc and normalized J sc respectively. The inset figure shows the JV characteristics of the OPD before and after stretchability tests. e) PPG signal magnitudes for red and green light in normal conditions with 99% oxygen saturation (left) and 90% in the reduced oxygen saturation condition (right). Reproduced with permission.[ 150 ] Copyright 2016, American Association for the Advancement of Science.
