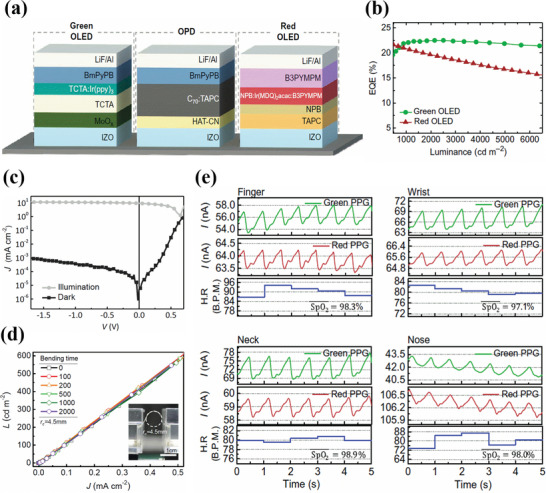
Figure 8.

a) Structure of green OLED, red OLED, and OPD. b) EQE of the green and red OLEDs as a function of luminance. c) J–V characteristics of the OPD under dark and illumination (AM 1.5). d) Luminance as a function of current density for the OLED after several bending cycles. The inset is the experimental set up for the bending test. e) PPG signal magnitudes for red and green light illumination along with the heart rate and SpO2 values at different sensing locations such as finger (left top), wrist (right‐top), neck (left bottom), and nose (right bottom). Reproduced with permission.[ 81 ] Copyright 2018, American Association for the Advancement of Science.
