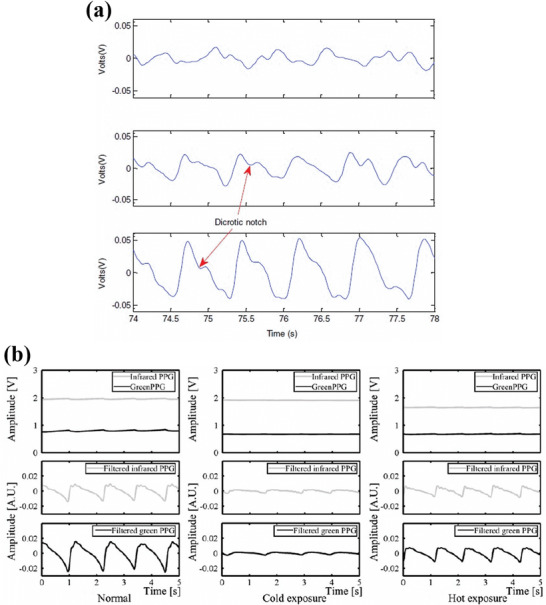
Figure 13.

a) AC component of the PPG signal magnitude for NIR light during cold exposure condition (top panel), normal condition (middle panel), and warm exposure condition (bottom panel). The dicrotic notch positions marked in the image indicate the closure of the heart aortic valve during the cardiac cycle. Reproduced with permission.[ 159 ] Copyright 2015, Elsevier Ltd. b) PPG signal magnitudes for green and NIR light during normal exposure (left), cold exposure (middle), and hot exposure condition (right). The top panels represent the DC component of the PPG signal magnitudes. The middle and bottom panels represent the bandpass filtered (0.7–10 Hz) AC components of the PPG signal magnitude for respectively IR and green light. Reproduced with permission.[ 100 ] Copyright 2011, Springer.
