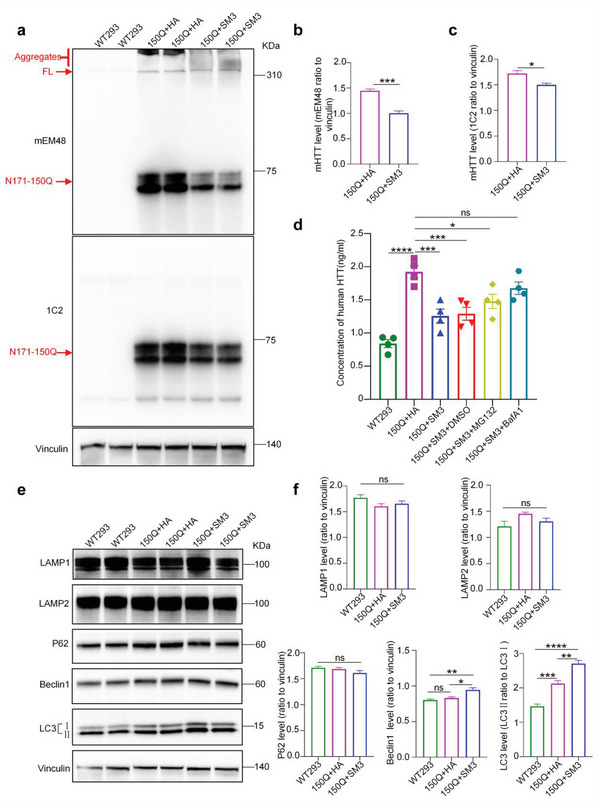
Figure 2.

Western blotting of SM3 and HTT‐N171‐150Q transfected 293 cells. a) Western blotting analysis of 293T cells transfected with HTT‐N171‐150Q or HTT‐171‐150Q cot‐transfected with SM3. b,c) Quantification of the ratios of mHTT recognized by mEM48 or 1C2 to vinculin on the western blots. The data were obtained from four independent experiments (n = 4). Data were analyzed by two‐tailed Student's t test and presented as mean ± SEM. *P = 0.0143; ***P = 0.0002. d) Quantification of human HTT using ELISA. n = 4 per group. Data were analyzed by one‐way ANOVA with Dunnett's multiple comparisons test and presented as mean ± SEM. *P = 0.0155; ***P = 0.0005(150Q+HA vs 150Q+SM3); ***P = 0.0008(150Q+HA vs 150Q+SM3+DMSO); ****P <0.0001; ns = 0.2693. e) Western blotting analysis of the transfected 293T cells, probed with LAMP1, LAMP2, P62, Beclin 1, and LC3 antibodies to detect whether the lysosomes‐autophagy pathway was activated. Vinculin served as a loading control. f) Quantification of the ratios of LAMP1, LAMP2, P62, and Beclin 1 to vinculin or LC3II to LC3I on the western blots. The data were obtained from four independent experiments (n = 4). Data are analyzed by one‐way ANOVA with Dunnett's multiple comparisons test and presented as mean ± SEM. Beclin 1: *P = 0.0113; **P = 0.0029. LC3: **P = 0.0018; ***P = 0.0008; ****P <0.0001. WT293 = Untransfected 293 cells.
