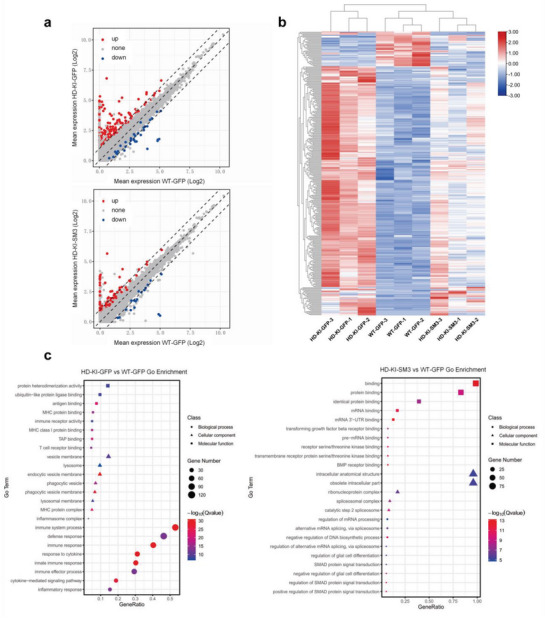
Figure 8.

RNA‐seq analysis of HD KI mice injected with SM3 or GFP. a) Scatter plots of differentially expressed genes (DEGs). The striatal mRNA expression of HD‐KI mice treated with SM3 is compared with those of the HD‐KI or WT mice treated with GFP (padj ≤ 0.05; fold change ≥ ± 2.0; n = 3). b) Heat map of DEGs expression in the striatum of wild type, HD KI‐140Q, and the SM3‐treated HD KI‐140Q mice. c) GO enrichment analysis of differentially expressed genes in the SM3‐treated and control HD KI‐140Q mice (padj ≤ 0.01).
