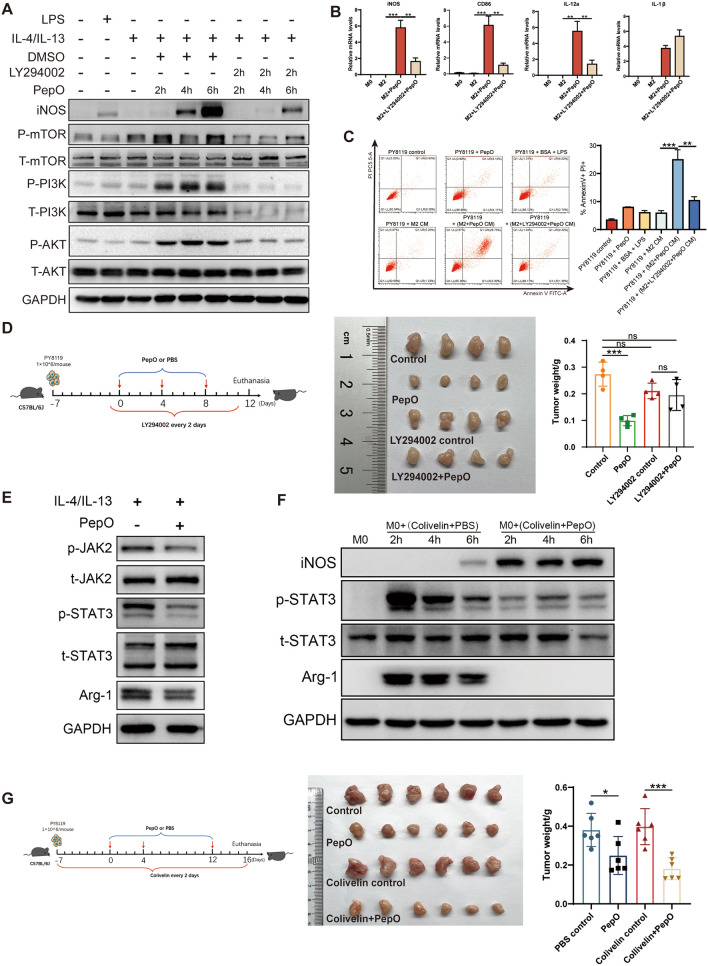
Fig. 4.
PepO reprogrammed M2 macrophage to be tumoricidal M1 by activating PI3K-AKT-mTOR and inhibiting JAK2-STAT3 pathway. A BMDM was treated as shown and the phosphorylation of PI3K-AKT-mTOR and the expression of iNOS was evaluated by western blot, 50 μM of LY294002 was used to block PI3K pathway 2 h before PepO treatment. B M2 BMDM pretreated with LY294002(50 μM) for 2 h, and then add PepO(5ug/ml) to the medium for 24 h. The transcription level of M1 markers were measured by RT-qPCR (n = 3). C FACS analysis of annexin V/PI staining and quantification of PY8119 cells treated with indicated CM for 48 h (n = 3). D PY8119 cells were used to establish TNBC in vivo and LY294002(50 mg/kg) was used to inhibit PI3K signaling pathway 24 h before PepO injection, and LY294002 was injected through i.p. every 2 days (D, left). Tumors were collected and the tumor growth was assessed by weight (n = 4, D, right). E BMDM were polarized into M2 by IL-4 and IL-13 for 24 h, and treated with PepO (5ug/ml) for another 24 h. The phosphorylation of JAK2-STAT3 and the expression of Arg-1 was evaluated by western blot. F BMDM was treated with colivelin (50 μg/ml) at the presence of PepO or PBS and the phosphorylation of STAT3 and the expression of iNOS and Arg-1 was evaluated by western blot. G PY8119 cells were used to establish TNBC in vivo and colivelin(1 mg/kg) was used to activate STAT3 signaling pathway 24 h before PY8119 injection, and colivelin was injected through i.p. every 2 days (F, left). Tu mors were collected and the tumor growth was assessed by weight (n = 6, F, right). One-way ANOVA with Tukey’s multiple comparisons test was used in (B), (C, right), (D, right), and (G, right). Bar graphs represent mean ± SEM, *P < 0.05, **P < 0.01, ***P < 0.001

