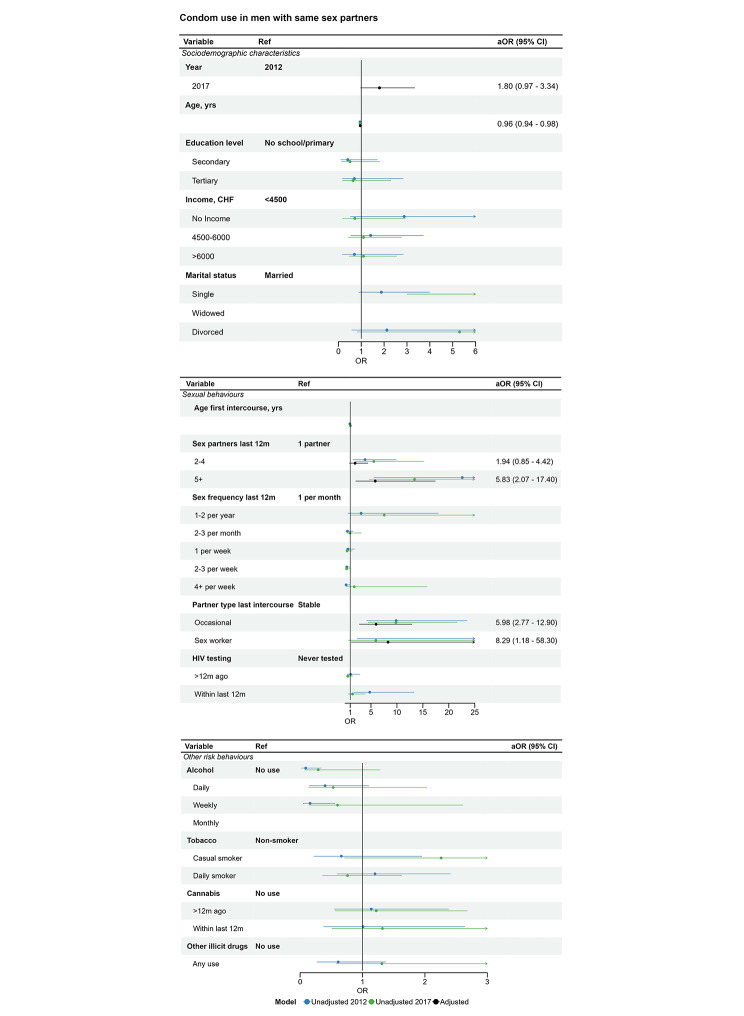
Fig. 3.
Condom use at last intercourse in men who report sex with men, logistic regression estimates from univariable and multivariable analysis. Legend: The forest plots show associations between condom use and (top) demographic variables, (middle) sexual behaviour and (bottom) substance use. Unadjusted and adjusted associations are displayed graphically. The right-hand column shows the adjusted aOR (95% CI) from the multivariable model, which includes age, number of sex partners and type of partner. The multivariable model only includes 2012 and 2017 because the denominator for 2007 excluded men who had never used a condom. Unadjusted OR (95% CI) are available in the supplementary material

