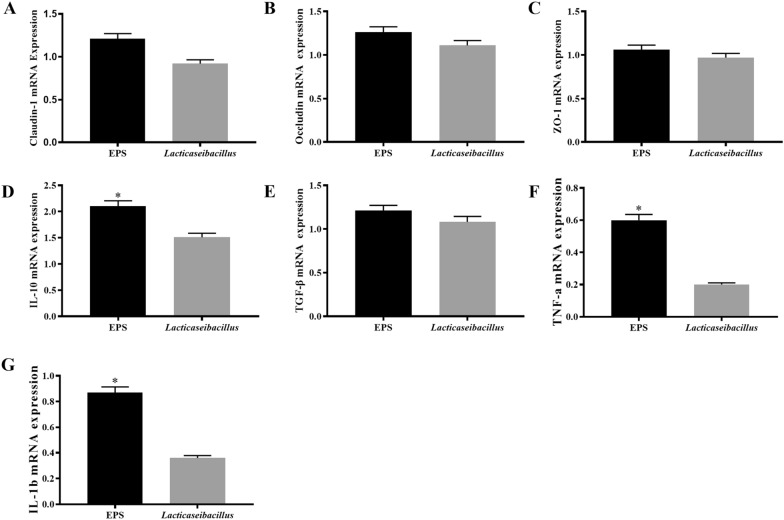
Fig. 2.
The relative anti-inflammatory and integrated genes were analyzed for the EPS and Lacticaseibacillus with the method of qRT-PCR experiments in the level of mRNA expression. The inflammatory and anti-inflammatory genes were IL-1b, TNF-a, IL-10 and TGF-b, and the integrated genes in the IPEC-J2 were Claudin-1, Occludin and ZO-1 with the concentration of 200 mg/mL for EPS and Lacticaseibacillus groups. The results are represented as the mean ± SEM of three independent experiments. The Livak method (2-∆∆CT method) was used to calculate the fold change compared to the control group. Data with * denote p < 0.05, ** denote p < 0.01

