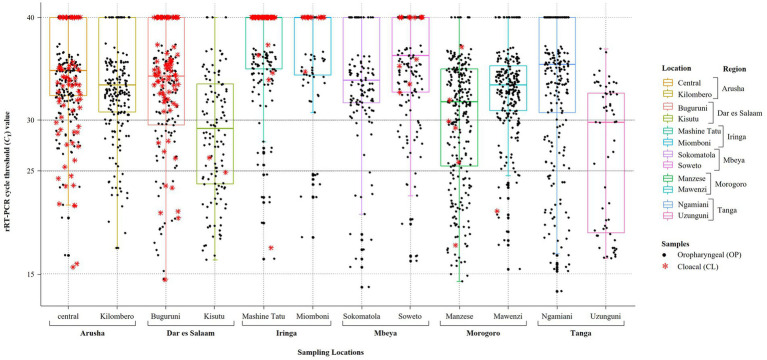
Figure 2.
Plot of the results obtained from screening of backyard chickens for NDV infections using the rRT-PCR L-test. Oropharyngeal (OP) and cloacal (CL) samples from 2049 chickens were screened using the L-test, including all OP samples (n = 2049) and 407 CL samples, which are plotted using black full circles and red asterisks, respectively. The 12 LBM sampling locations in six regions of Tanzania are indicated on the x-axis and the rRT-PCR cycle threshold (CT) values are shown on the y-axis. For the plotting, samples that were NDV-negative by the rRT-PCR L-test were assigned a CT cutoff value of 40 (shown on the CT = 40 line on top of the plot). The averages of the CT values for the OP samples are indicated by the boxplots, which are color-coded for each of the 12 LBMs. Samples with CT below 25 were considered to be “strongly NDV-positive,” some of which were selected for further analysis using NGS as described in the text.

