
Figure 1. Insights from past clinical trials and new approaches.
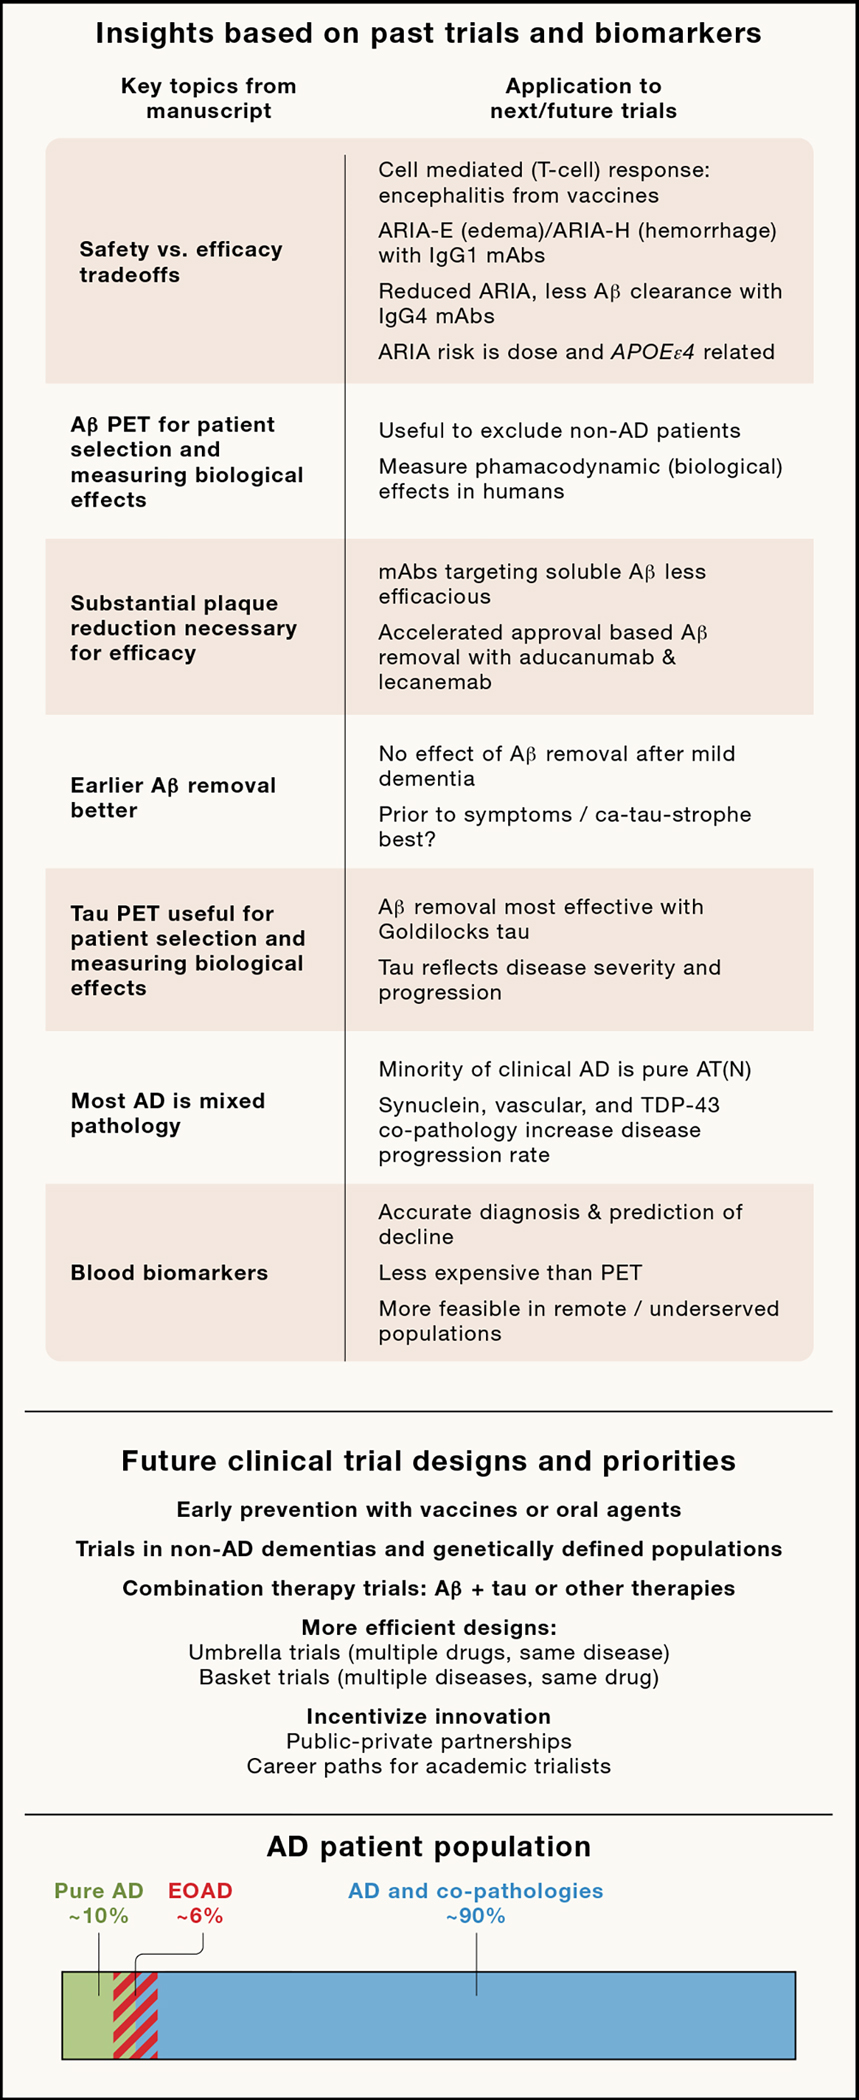
(Top panel) Insights from past biomarker development and clinical trials. (Middle panel) New trial designs and priorities to accelerate clinical development. (Bottom panel) Bar represents percent estimates based on autopsy cohorts of clinical AD cases with pure AD (ATN pathology without co-pathology), AD with co-pathology (e.g., ATN plus vascular, α-synuclein and/or TDP-43) 75 and relative percentage of Early Onset AD (EOAD; first symptoms before age 65).