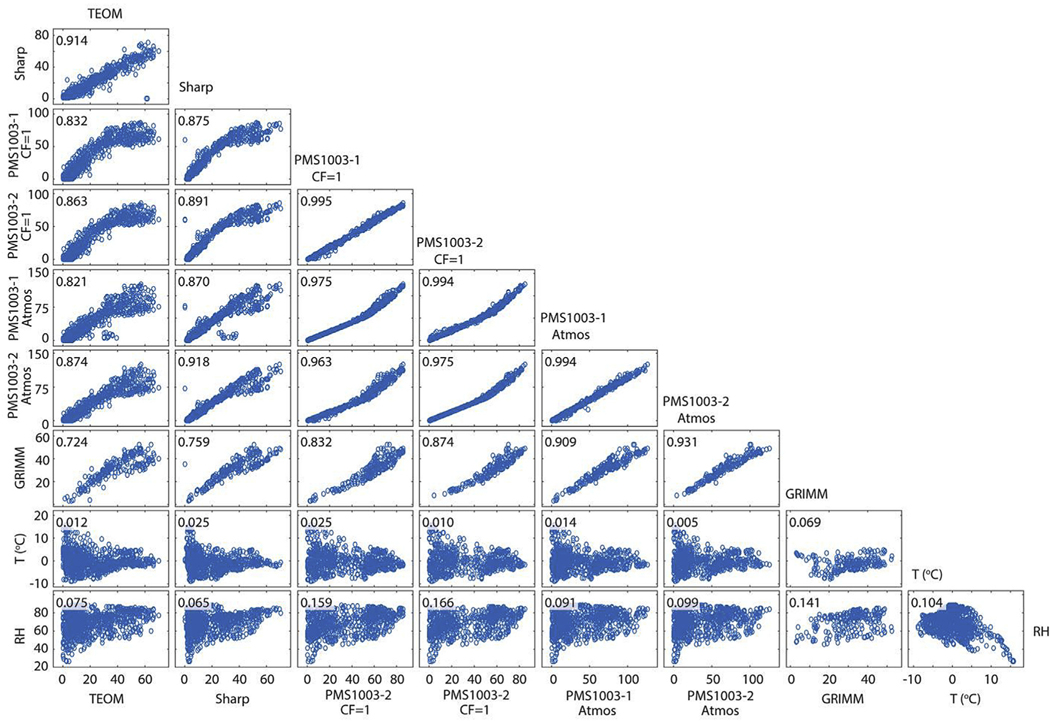
Fig. 3.
Scatter plots and correlation coefficients for (μg/m3) concentrations (PMS 1003–1/2) with FEMs (TEOM and Sharp), research-grade monitor (GRIMM), temperature and RH. No correlation was seen between concentration measured between any of the devices and wind speed (R2 of 0.03–0.04), results not shown.

