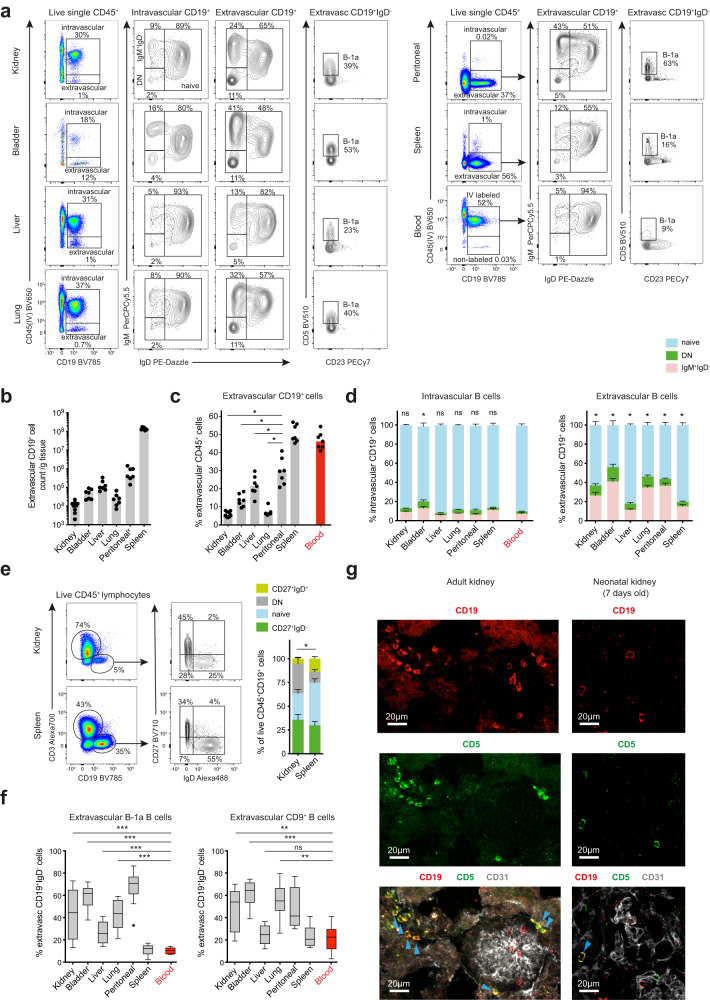
Fig. 1. Extravascular B cells present across murine organs in homeostasis.
a Flow-cytometry profiling of extra- and intravascular CD19+ cells in WT C57BL/6 mouse kidney, urinary bladder, liver, lung, spleen, peritoneal lavage and blood (kidneys n = 9, other organs n = 7). Data representative of three independent experiments. b Absolute extravascular B cell counts per gram of tissue across organs shown in a. xPeritoneal B cell counts calculated per single lavage and adjusted for total volume of PBS injected. c Percentage of B cells within live extravascular CD45+ cell subset across organs shown in a. Kidney *P = 0.0156, bladder *P = 0.0156, liver *P = 0.0312, lung *P = 0.0156. d Proportion of naïve (IgD+IgM+), IgM+IgD- and switched (double negative, DN) B cells from intra- (left) and extravascular (right) compartments in organs shown in a, n = 7 per group, means with SEM shown. The difference in naïve B cells proportions between blood and a tested organ is compared; intravascular: kidney P = 0.2188, bladder *P = 0.0156, liver P = 0.1562, lung P = 0.3750, peritoneal P = 0.6250, spleen P = 0.0781; extravascular: *P = 0.0156. e Flow-cytometry identification of CD45+CD3-CD19+ cells in matched kidney and spleen from deceased human organ donors (left) and their phenotyping based on expression of IgD and CD27 (middle). Percentage of naïve (IgD+CD27-), switched memory (IgD-CD27+), DN and double positive cells within CD45+CD3-CD19+ cell subset shown (right) (n = 10 per group, means with SEM shown). The difference in naïve B cells proportions between kidney and spleen is tested, *P = 0.0137. f Tukey plots show percentage of B-1a (CD19+CD23-CD5+) and CD9+ cells in extravascular IgD- B cell compartments of organs described in a. Data pooled from three independent experiments at two independent SPF animal facilities (total n = 12 per organ); %B-1: kidney ***P = 0.0010, bladder, liver and lung ***P = 0.0005; %CD9+ cells: kidney **P = 0.0024, bladder ***P = 0.0005, liver P = 0.4785, lung **P = 0.0029. g Confocal microscopy of adult (left) and neonatal (right) renal cortex from WT C57BL/6 mice focusing on extravascular localization of CD5+ B cells. Sections stained for CD19 (red), CD5 (green) and CD31 (grey). Representative of three independent experiments. Blue arrows point at extravascular CD19+CD5+ B cells. Blood samples represent always only intravascular cells. P values were calculated using two-tailed Wilcoxon matched-pairs signed rank test (c-f). Bar plots show medians unless stated otherwise. Source data are provided with this paper.

