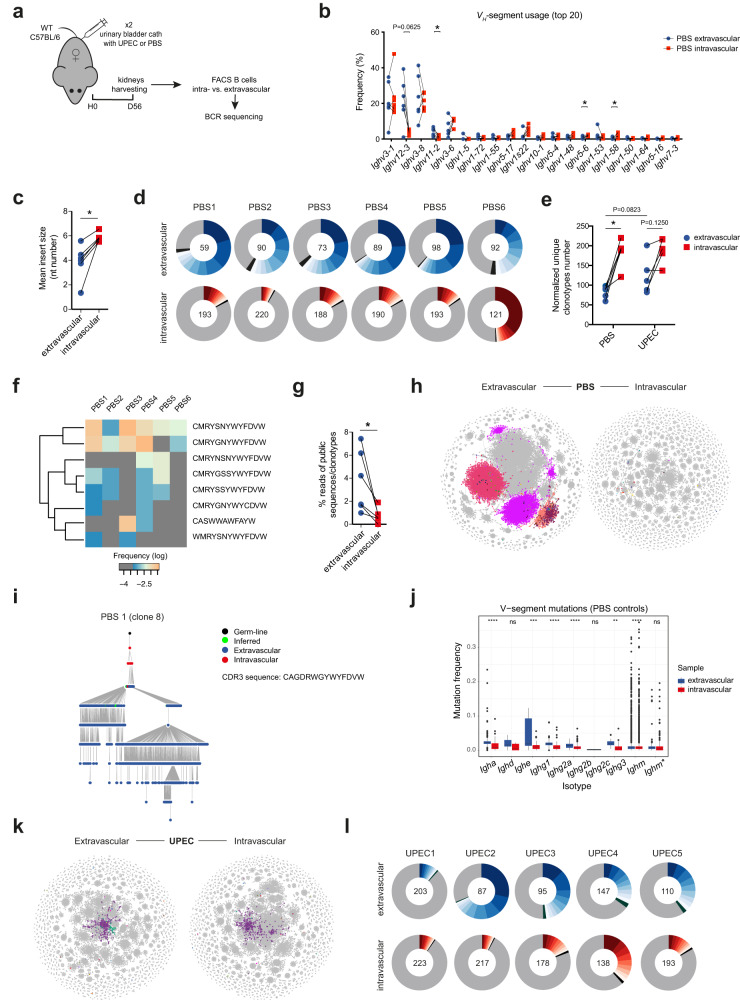
Fig. 4. Tissue-resident B cell repertoire is less diverse and is expanded following bacterial challenge.
a BCR-seq experimental setup: WT C57BL/6 female mice had urinary bladders inoculated twice with UPEC (n = 5), or PBS (n = 6). After 56 days, their intra- and extravascular kidney B cells were sorted and BCR-sequenced. b, c Comparison of 20 most abundant VH-segment frequencies (b) and mean insert sizes (c) between matched extra- and intravascular kidney BCR compartments from control (PBS) animals, *P = 0.0312. d, l Donut plots showing proportion of ten most abundant Igh clonotypes (each clone coloured) found in matched extra- and intravascular kidney BCR compartments from control (PBS) (d) and infected (UPEC) mice (l). Normalized number of unique Igh clonotypes found in each sample is indicated in the centre of each donut. e Pair-wise BCR repertoire diversity comparison of extra- and intravascular kidney B cells from control (PBS) and infected (UPEC) mice based on normalized number of unique Igh clonotypes per sample, *P = 0.0312. f Heatmap showing log frequencies of “public” Igh clonotypes (complete CDR3, V- and J-segment nucleotide match), shared by extravascular B cells across control (PBS1-6) kidneys. Clonotypes CDR3 amino-acid sequence displayed. g Pair-wise comparison of percentage of “public” Igh clonotypes (defined in f) reads within extra- vs. intravascular kidney BCRs from control (PBS) animals, *P = 0.0312. h, k Representative BCR network plots capturing Igh immune repertoire of extra- and intravascular kidney B cells in control (PBS1) (h) and infected (UPEC1) (k) mouse. Each vertex represents a unique Igh sequence. Edges are generated between vertices that differ by a single nucleotide (non-indel). Clusters/vertices sharing the same CDR3 sequence and present both in extra- and intravascular repertoire are coloured. i Representative lineage tree of one Igh clone (No. 8) shared between extra- and intravascular kidney compartment (based on identical nucleotide CDR3 sequence) found in control mouse 1. The tree is rooted in the closest germ-line VH gene allele in the IMGT database (black dot). Each dot represents a unique Igh sequence. j Tukey box plots comparing total mutation frequency (including silent and replacement mutations) in VH-segments (downsampled to n = 1000 per group/isotype) between extra- and intravascular kidney B cells from control (PBS) mice. Ighm* represents only sequences with no Ighd counterpart (sharing CDR3 nucleotide sequence). **P < 0.01, ***P < 0.001, ****P < 0.0001 and ns P > 0.05. P values were calculated with two-tailed Wilcoxon matched-pairs signed ranked test (b, c, e, g, j) and two-tailed Mann-Whitney U test (e – comparison between extravascular compartments of PBS and UPEC groups). Source data are provided with this paper.

