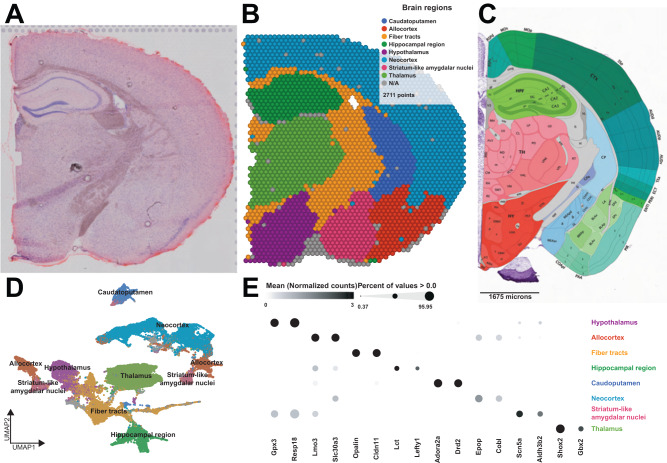
Fig. 1. Spatial patterns of gene expression define anatomically distinct brain regions.
A Example of coronal tissue section H&E histology staining from sample 4. This process was repeated for each of the 16 mice. B Graph-based cluster identification from spot-level (2711 spots) of sample 4. Each spot is colored based on the transcriptional signature computed from 20 principal components using Louvain clustering algorithm. The brain regions are labeled in the colored legend. This process was repeated for each of the 16 mice. C Adapted screenshot of the Allen Reference Atlas—Mouse Brain (coronal section image 72 of 132, position 285, http://atlas.brain-map.org/). D UMAP plot based on the transcriptional signature of each spot. E Bubble plot of the most significant computed biomarkers for each brain region. The bubble chart shows the expression level of biomarkers in each brain region. Bubble diameters are proportional to the percentage of spots that show expression of the biomarker. For each brain region, two significant biomarkers are displayed.

