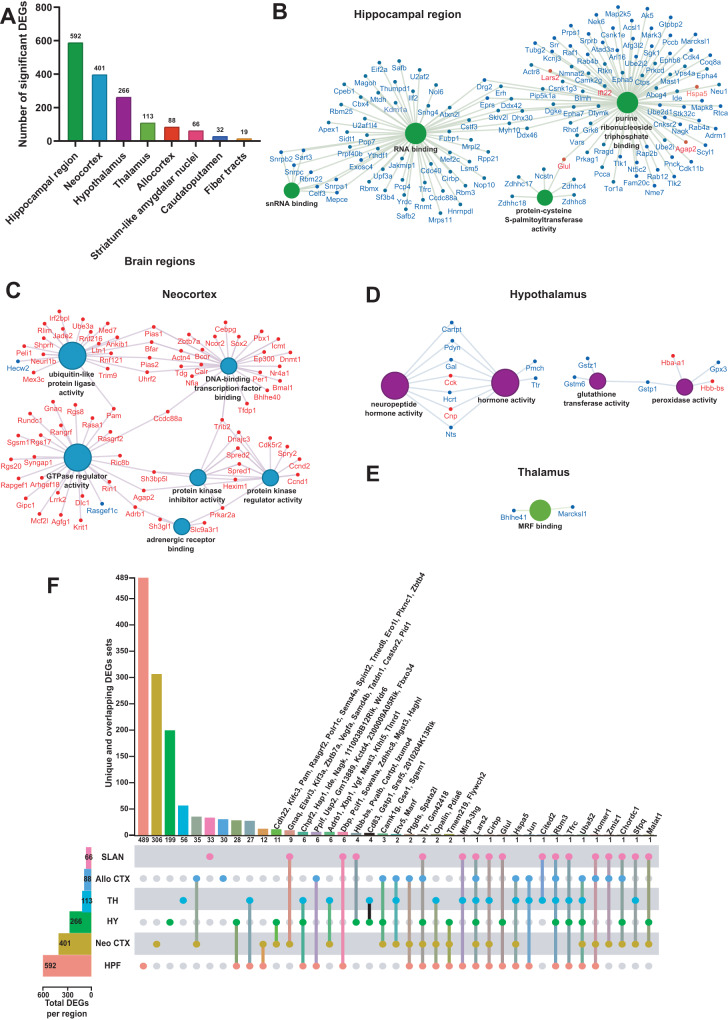
Fig. 2. The hippocampal region is the brain region the most transcriptionally affected after sleep deprivation.
A Histogram representing the number of significant differentially expressed genes (DEGs) across each brain region previously identified. Molecular functions enriched from the significant DEGs in the hippocampal region (B), neocortex (C), hypothalamus (D), thalamus (E). A gene is significant if its FDR step-up <0.001 and its log2fold-change ≥ |0.2 | . The size of the circle for each enriched molecular function is proportional to the significance. Only molecular functions with a corrected p < 0.05 are displayed (two-sided hypergeometric test, Bonferroni step down). The DEGs within these molecular functions are color coded to show whether they are downregulated (blue) or upregulated (red). F UpSet plot of interactions between each brain region that have more than 50 significant DEGs (fiber tracts and caudatoputamen excluded). The number of DEGs submitted for each brain region is represented by the histogram on the left (0–600 range). Dots alone indicate no overlap with any other lists. Dots with connecting lines indicate one or more overlap of DEGs between brain regions. The number of DEGs in a specific list that overlap is represented by the histogram on the top. For spatial expression patterns with smaller numbers of DEGs, we were able to list the gene names above their respective histogram. Genes are labeled for the smallest lists. HPF Hippocampal Formation, Neo CTX Neocortex, HY Hypothalamus, TH Thalamus, Allo CTX Allocortex, SLAN Striatum-like amygdalar nuclei.

