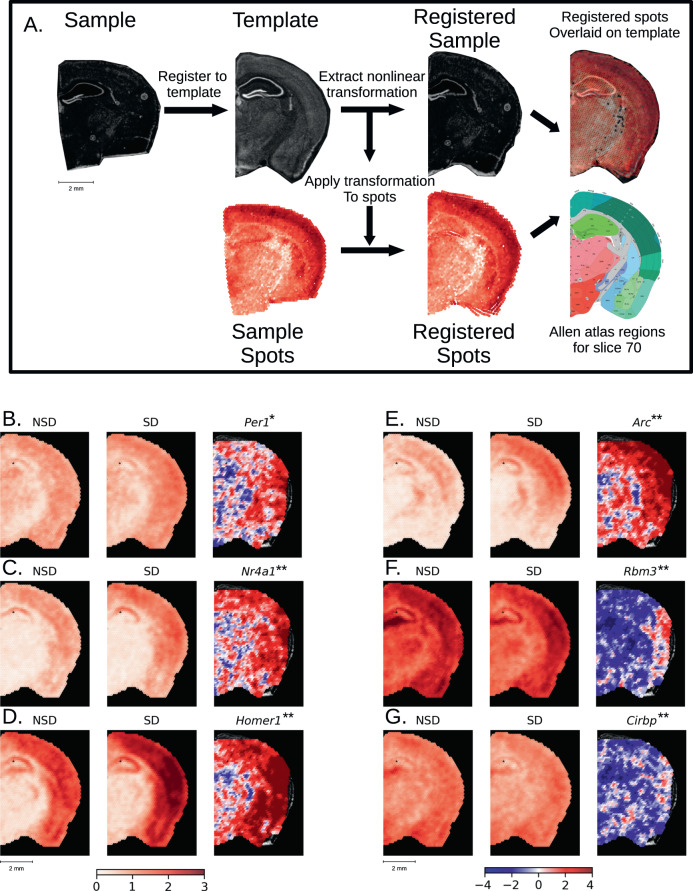
Fig. 5. Registration of spatial data to Allen Common Coordinate Framework and statistical analysis of aligned transcriptomic spots.
A Nonlinear registration of the tissue image from a single brain slice (A1) and its transcriptomic spot coordinates (A2)—shown as example: the gene Camk2n1 – to the template image (A3), slice 70 from the Allen P56 Mouse Common Coordinate Framework (CCF), Allen Mouse Brain Atlas, mouse.brain-map.org. Due to the nonlinear nature of the registration, we were able to precisely align the sample image (A4) to landmarks in the template image and apply that transformation to the spot coordinates (A5). To account for different numbers of spots in individual samples, digital spots spaced at 150 µm in a honeycomb were created for the template slice. Each digital spot is populated with the log base 2 normalized transcriptomic counts from the 7 nearest spots from each sample in a group (A7). This approach allows the comparison of gene expression across entire brain slices in an unrestricted inference space. B–G Samples were split into non-sleep deprived (NSD, n = 6, 42 sample spots per digital spot) and sleep deprived (SD, n = 7, 49 sample spots per digital spot). The range of the color bar for the mean calculations is set from 0 to a log2 fold-change of 3, the maximum fold change for the genes shown, while the color bar for the SD > NSD t-statistic (B3–G3) is bounded to [−4,4], which is approximately the equivalent to the FDR < 0.1. *indicates the gene is significant at FDR < 0.1, **indicates significance at FDR < 0.05. We show a selected group of 6 genes from the 413 DEGs (Supplementary Data 10) (B–G). Panel 1 shows for each gene (B1–G1) the mean normalized gene count in NSD, panel 2 depicts the mean normalized gene count in SD (B2–G2) and panel 3 shows the t-statistics (B3–G3). The following DEGs are depicted: B Per1, 4 significant spots. C Nr4a1, 29 significant spots. D Homer1, 306 significant spots. E Arc, 168 significant spots. F Rbm3, 31 significant spots. G Cirbp, 9 significant spots.

