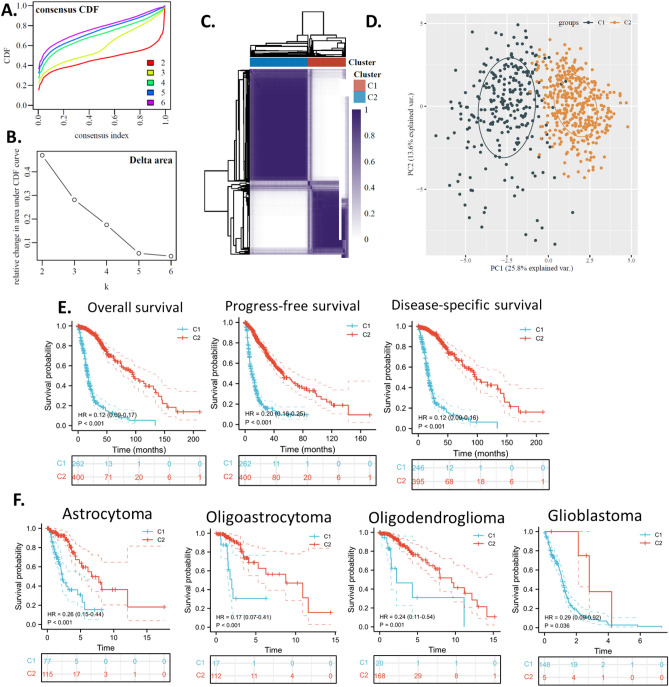
Figure 2.
Glioma subtype based on the glioma up-regulated MAPK signaling pathway gene set. The glioma up-regulated MAPK signaling pathway gene set was used to cluster C1/C2 and assign a prognosis. TCGA data were used to calculate all analyses in this figure. (A) Consensus CDF plot of subtype numbers (k = 2–6). (B) Delta area plot of the consensus CDF plot. (C) Cluster trees and consensus matrix of subtypes. (D) PCA plot of the consensus clustering. (E) survival KM plots of the subtypes. (F) Overall survival KM plot of the MAPK subtypes within histologic subtypes. The “ggplot2” package was utilized to plot the figures with R software.

