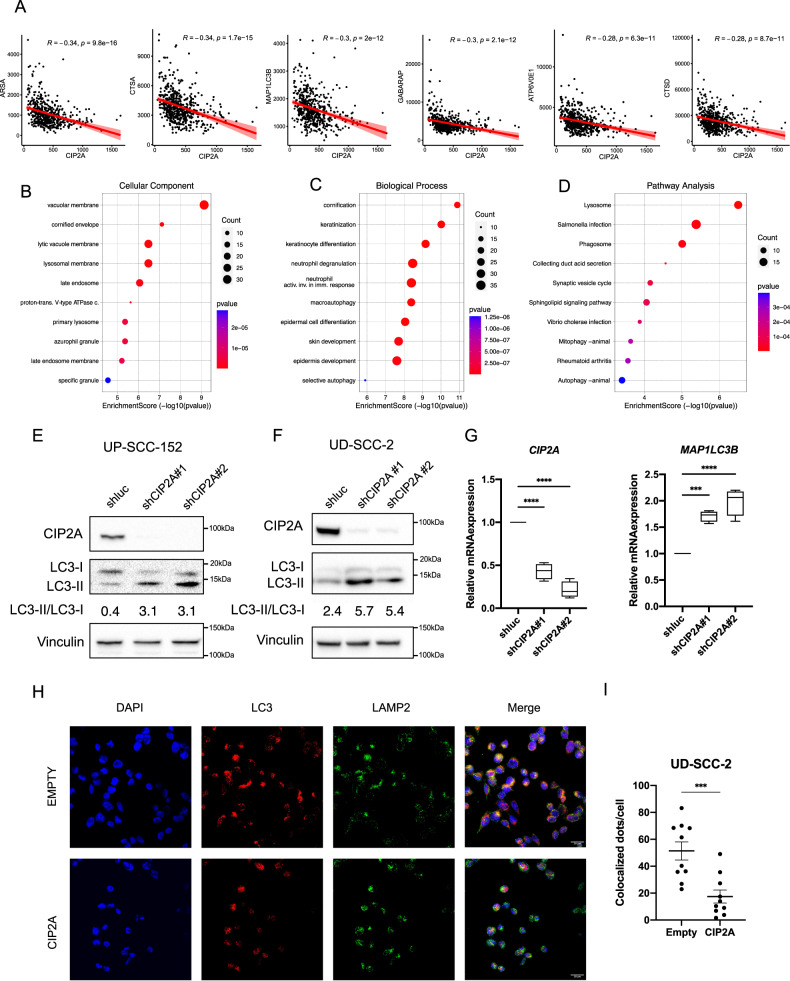
Fig. 5. CIP2A expression affects autophagy in HNC.
A Scatter plots express the Pearson correlation (red line) between mRNA expression of CIP2A and autophagy/lysosomal genes (RSEM) in HNC samples within the Pancancer dataset from the TCGA. B–D GO and KEGG enrichment bubble plots of top 100 genes inversely correlated with CIP2A expression in HNC samples within the Pancancer dataset from the TCGA: Cellular compartment (B), Biological process (C) and KEGG pathway (D). E, F Western blot shows LC3 protein levels upon knock-down of CIP2A in UPCI-SCC-152 (E) and UD-SCC-2 (F) cell lines. Vinculin was used as loading control. LC3-II/LC3-I ratio is reported. G Boxplots showing mRNA expression of MAP1LC3B or CIP2A in UD-SCC-2 cells transduced with shCIP2A compared to the shluc. Whiskers express Tukey analysis. Statistical analysis was performed using t-test (n = 4). H IF staining of LC3 (red) and LAMP2 (green) in UD-SCC-2 cells transfected with CIP2A or the empty vector. Nuclei were stained with DAPI (Blue). I Quantification of Colocalized LAMP2 and LC3 dots/cell in UD-SCC-2 transfected with CIP2A or the empty vector. Unpaired t-test was performed. Bars represent mean ± SD (n = 10).

