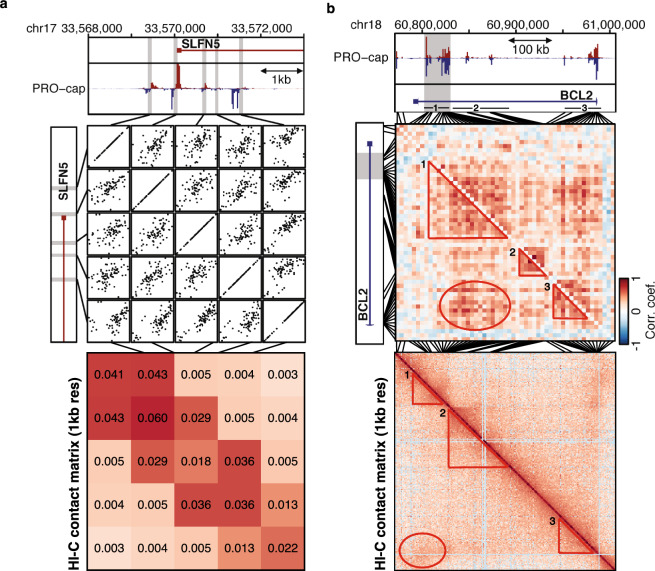
Figure 1.
Covariation of tTRE transcription as an indicator of correlated interactions. (a) High-resolution example of the co-expression analysis strategy at the SLFN5 locus. The PRO-cap signal at each variably expressed tTRE (proximal enhancer or promoter; grey box) is correlated with the PRO-cap signal of each other variably expressed tTRE in the vicinity, across LCL samples. The lower panel shows the corresponding heatmap of the Hi-C contact matrix with a resolution of 1 kilobase. (b) Coexpression over a larger region at the BCL2 locus reveals putative correlated interactions both within and between tTRE clusters (grey box: BCL2 super-enhancer). Heatmap shows correlation coefficients for correlations between tTRE pairs across LCL samples. The lower panel shows the corresponding heatmap of the Hi-C contact matrix with a resolution of 1 kb. The regions of high interaction are highlighted with a circle and three triangles, each representing a different interaction.

