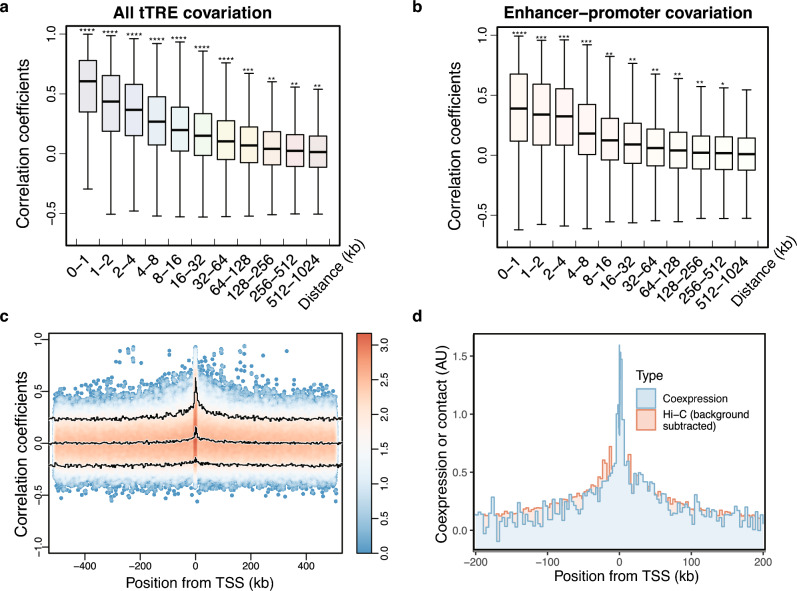
Figure 2.
Distance-dependent tTRE co-expression, compared to Hi-C contacts and mRNA PRO-cap co-expression patterns. (a) Co-expression of tTREs decreases with increasing distance. tTRE pairs are binned according to the distance between them and the distribution of correlation coefficients in each bin is plotted as a boxplot. ****P < 1 × 10⁻⁴, and ***P < 1 × 10⁻³, and **P < 1 × 10⁻² by Wilcoxon rank sum test. (b) Covariation between PRO-cap read counts between promoter tTREs and enhancer tTRE (eRNA) expression levels. The distribution of correlation coefficients in each bin is shown as a boxplot. ****P < 1 × 10⁻⁴, and ***P < 1 × 10⁻³, and **P < 1 × 10⁻² by Wilcoxon rank sum test. (c) Distribution of correlation coefficients between mRNA TSS and tTREs as a function of their relative positions. Pairs were binned based on both the distance between tTRE and mRNA TSS and the orientation of the pair (TRE upstream: negative numbers, tTRE downstream: positive numbers). Density scatter plots show the distribution of the correlation of mRNA expression (RNA-seq7) and tTRE expression (PRO-cap), and the 3 lines represent the quantile trajectories of the 5th percentile, median, and 95th percentile of the correlation coefficients. (d) Quantile (median) traces of Hi-C contacts compared to mRNA-PRO-cap correlation of co-expression. Traces of background subtracted Hi-C contacts between TSS-tTRE (red) superimposed on the distance-dependent decay of PRO-cap co-expression (blue). The y-axis is in arbitrary units (AU), where 1 unit corresponds to either PRO-cap correlation coefficient of 0.1 or a Hi-C contact frequency difference of 4.5 × 10⁻³.

