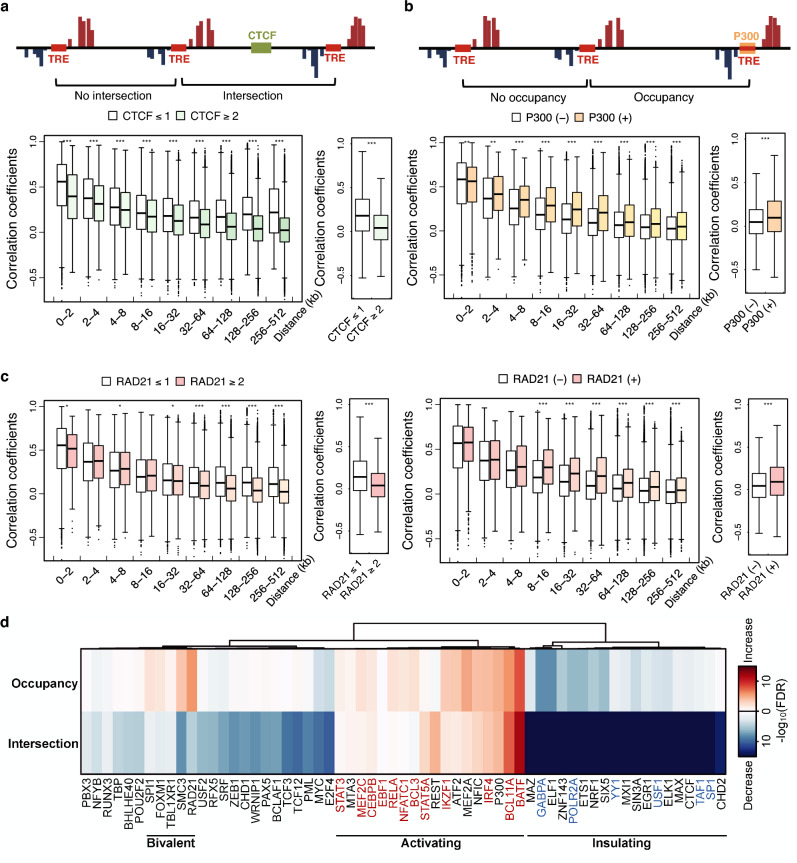
Figure 3.
Transcription factor binding sites are associated with changes in tTRE co-expression. (a) Intersection by an insulator is associated with decreased tTRE co-expression. Top: Diagram of CTCF crossing the region between two tTREs. Bottom: Distribution of correlation coefficients for tTRE pairs intersected by 2 or more CTCF sites and 1 or less, binned by distance (left) or total (right). ***P < 1 × 10⁻³ by Wilcoxon rank sum test. (b) Coactivator occupancy is associated with increased tTRE co-expression. Top: Diagram of P300 occupancy plot of a tTRE. Bottom: Correlation coefficients for tTRE pairs occupied or not occupied by P300, binned by distance (left) or total (right). ***P < 1 × 10⁻³ and **P < 1 × 10⁻² by Wilcoxon rank sum test. (c) Intersection and occupancy by RAD21 have a “bivalent” association with tTRE co-expression. Left: Distribution of correlation coefficients for tTRE pairs intersected by 2 or more RAD21 sites and 1 or less, binned by distance (left) or total (right). Right: Coactivator occupancy increases tTRE co-expression. Correlation coefficients for tTRE pairs occupied or not occupied by RAD21, binned by distances (left) or total (right). ***P < 1 × 10⁻³ and *P < 1 × 10⁻¹ by Wilcoxon rank sum test. (d) The effect of TF intersection and occupancy on tTRE interactions for 61 TFs. The heat map shows the − log10(FDR) for ∆AUC between with and without TF intersection or occupancy (Supplementary Fig. 2b,c). TFs are ordered by minimum variance hierarchical clustering. The number of tTRE pairs in each distance bins in panels (a–c) are indicated in Supplementary Table 3.

