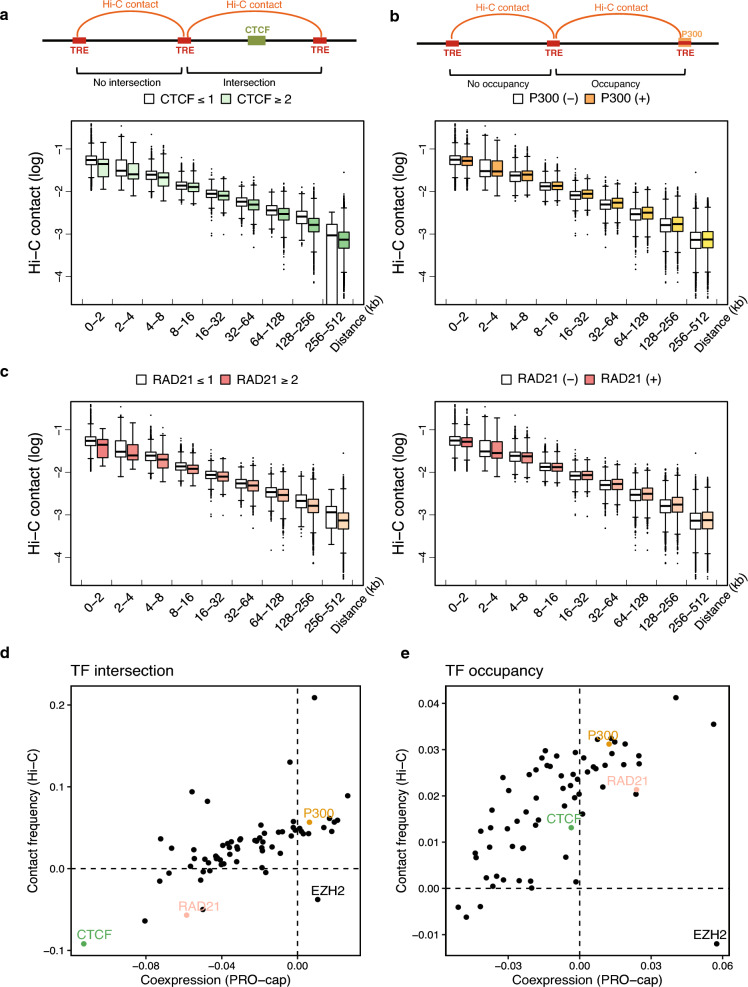
Figure 4.
Transcription factor binding sites correlate with variations in the co-expression of tTRE Hi-C contacts. (a) Intersection by an insulator is associated with decreased Hi-C contact frequency. Top: Diagram of the intersecting CTCF binding site. Bottom: Distributions of Hi-C contact frequencies for tTRE pairs intersected by 2 or more CTCF sites and 1 or less, binned by distance. (b) Coactivator occupancy is associated with increased Hi-C contact frequency. Top: Diagram of P300 occupancy of a tTRE. Bottom: Hi-C contact frequencies for tTRE pairs occupied and unoccupied by P300, binned by distance. (c) “Bivalent” association of RAD21 with Hi-C contact frequency depending on tTRE intersection or occupancy. Left: Hi-C contact frequency distributions for tTRE pairs intersected by two or more RAD21 sites and one or less, binned by distances. Hi-C contact frequencies for tTRE pairs occupied or not occupied by RAD21, binned by distances. (d) Scatterplot of TF-dependent ∆AUCs comparing PRO-cap coexpression and Hi-C contacts. Each dot represents a TF, and selected TFs are highlighted. Left: ∆AUC scatterplot of TF overlap. Right: ∆AUC scatterplot of TF occupancy. The number of tTRE pairs in each distance bins in panels (a–c) are indicated in Supplementary Table 3.

