Abstract
Cholinergic basal forebrain (CBF) signaling exhibits multiple timescales of activity with classic slow signals related to brain and behavioral states and fast, phasic signals reflecting behavioral events, including movement, reinforcement and sensory-evoked responses. However, it remains unknown whether sensory cholinergic signals target the sensory cortex and how they relate to local functional topography. Here we used simultaneous two-channel, two-photon imaging of CBF axons and auditory cortical neurons to reveal that CBF axons send a robust, nonhabituating and stimulus-specific sensory signal to the auditory cortex. Individual axon segments exhibited heterogeneous but stable tuning to auditory stimuli allowing stimulus identity to be decoded from population activity. However, CBF axons displayed no tonotopy and their frequency tuning was uncoupled from that of nearby cortical neurons. Chemogenetic suppression revealed the auditory thalamus as a major source of auditory information to the CBF. Finally, slow fluctuations in cholinergic activity modulated the fast, sensory-evoked signals in the same axons, suggesting that a multiplexed combination of fast and slow signals is projected from the CBF to the auditory cortex. Taken together, our work demonstrates a noncanonical function of the CBF as a parallel channel for state-dependent sensory signaling to the sensory cortex that provides repeated representations of broad range of sound stimuli at all points on the tonotopic map.
The cholinergic basal forebrain (CBF) is the primary source of acetylcholine to the neocortex, hippocampus and amygdala1–5. CBF signals are implicated in modulating attention6–10, supporting memory encoding11–15 and shaping cortical plasticity16–20. However, the classic view of cholinergic neuromodulation as slow, spatially diffuse and regionally nonspecific is rapidly evolving21–23. Anatomical studies have revealed a more structured input–output organization of the CBF, in which different CBF subdivisions receive distinctive inputs which are then projected in a target-specific manner. For example, recent work has shown that the caudate tail of the basal forebrain receives a rich set of inputs, including from the neocortex, striatum and thalamus, and preferentially projects to sensory and motor cortices compared with prefrontal regions4,5,24–26.
In addition to this structural modularity, behavioral studies indicate that cholinergic neuromodulation operates at multiple timescales to convey different facets of information–slower tonic signals reflect modulations in internal state and behavioral contexts27–32, while faster phasic signals are associated with reinforcement33–36, movement34,37–39 and sensory cues40,41. Fast CBF transients that are target-specific and tied to external features may provide a complement to slower, diffuse signaling of internal brain state to influence downstream cortical networks. In particular, native cholinergic activity in response to sensory cues has previously been observed using bulk calcium photometry in the caudate tail of the basal forebrain40,41, a region which receives afferent projections from the medial geniculate body (MGB) and sends strong efferent projections to the auditory cortex5,24,40–42, suggesting that the CBF may relay sensory information to downstream targets. However, it remains unknown whether such phasic sensory signaling is received by sensory cortices, and how these signals relate to the local functional topography. Moreover, little is known about the interactions between CBF signaling at different timescales. Here, we used two-color, two-photon microscopy to record the activity of CBF axons and cortical neurons in layer 1 (L1) and layer 2/3 (L2/3) of the auditory cortex to investigate the spatiotemporal characteristics of sensory-evoked cholinergic activity.
Results
CBF axons relay sensory information to auditory cortex
CBF neurons in the basal forebrain have previously been observed to respond to auditory stimuli that are not behaviorally relevant or associated with reward or punishment (henceforth referred to as ‘neutral’)40,41. We investigated the extent to which cholinergic signals relay auditory information to the auditory cortex–a downstream cortical target-by using two-photon microscopy to record the activity of CBF axonal projections to superficial layers of the auditory cortex. We expressed an axon-targeted variant of the genetically encoded calcium indicator GCaMP6s (axon-GCaMP6s) specifically in cholinergic neurons using a cre-dependent viral injection in the basal forebrain of ChAT-cre mice (Extended Data Fig. 1) and recorded the calcium activity of CBF axonal projections to L1 and L2/3 of the auditory cortex (n = 8 animals; Fig. 1a,b). Our optical approach allowed us to investigate both the spatial and temporal dynamics of cholinergic signals in subcellular axonal processes (Fig. 1c, example animal ‘mse012’). In total, we identified 15,777 CBF axonal regions-of-interest (ROIs; henceforth referred to as ‘axon segments’) in 73 sites across the auditory cortex of eight animals (n = 9 ± 7 sites per animal). We presented passively listening head-fixed animals with 20 repetitions of white noise (100 ms, 70–80 dB SPL) and observed multiple axon segments that were significantly responsive to the neutral stimulus (Fig. 1d–f). Across eight animals, 24.8 ± 21.9% of identified axon segments responded to white noise and were distributed across the auditory cortex (Fig. 1g, example animal ‘mse012’). We observed that a similar percentage of axon segments responded to frequency up-sweeps (24.6 ± 18.8%) and down-sweeps (22.3 ± 11.8%) across the broad extent of the auditory cortex, with many axon segments responding to multiple classes of auditory stimuli (Extended Data Fig. 2). Cholinergic axons also responded to auditory stimuli at lower intensities (Extended Data Fig. 3).
Fig. 1 |. Robust, nonhabituating and stimulus-specific auditory responses of cholinergic axons.
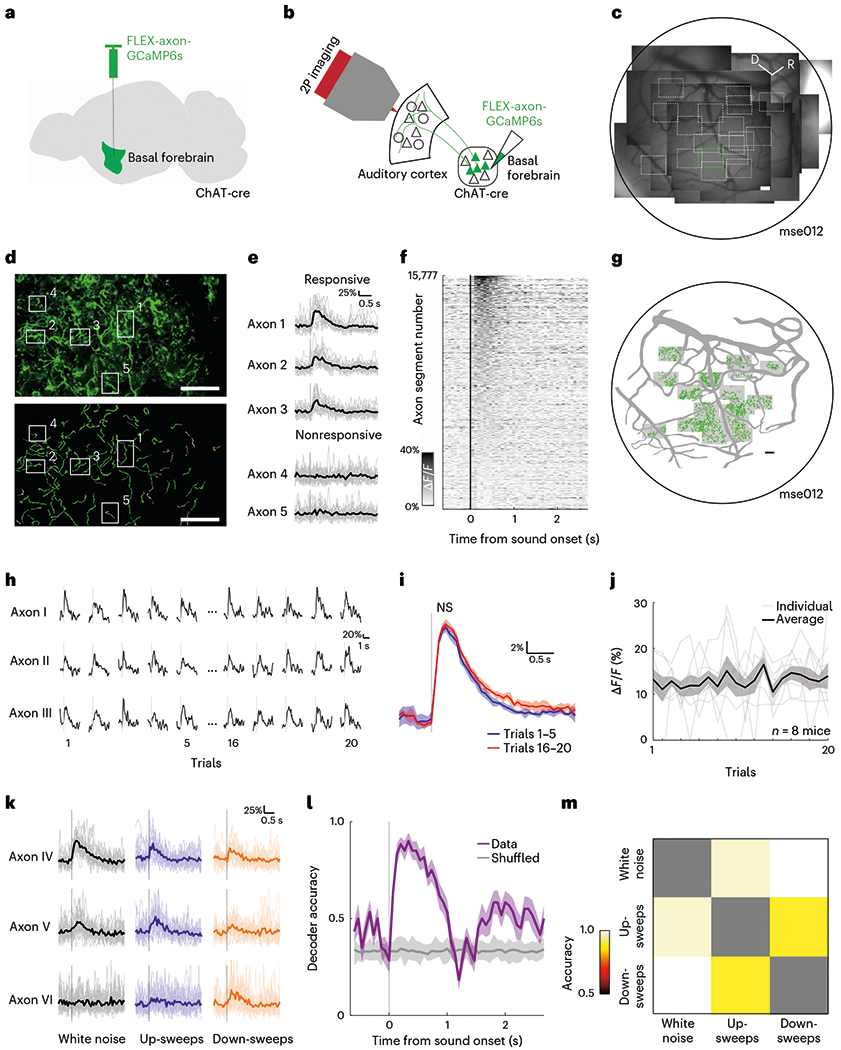
a, Schematic of basal forebrain viral injection. b, Schematic of CBF projection to the auditory cortex and imaging strategy. c, Composite widefield image of all recording sites in one example animal, ‘mse012’. Black border demarcates approximate location of cranial window and white boxes indicate two-photon imaging sites at ×4 magnification. Green box indicates location of example site in d. Scale bar, 100 μm. d, Top, mean fluorescence image of cholinergic axons (green, axon-GCaMP6s) in example recording site. In total, 146 recording sites were analyzed. Bottom, manually identified axon segments in example site. Responsivities of example axon segments in boxes 1–5 are shown in e. Scale bar, 50 μm. e, Example traces of axon segments that are responsive and nonresponsive to white noise presentation. Bold line indicates mean response across 20 presentations; faded traces indicate responses to individual presentations of white noise. Vertical gray line indicates presentation of white noise. f, Heatmap of average evoked response (ΔF/F) to white noise for all identified axon segments (n = 15,777). g, Spatial distribution of axon segments responsive to white noise (green) in one example animal, ‘mse012’. Shaded boxes indicate recording sites. Scale bar, 100 μm. h, Example traces of axon segments for 1–5 and 16–20 presentations of white noise stimulus. Vertical gray line indicates presentation of white noise. i, Mean evoked response of all responsive axon segments to 1–5 (blue) and 16–20 (red) presentations of white noise (t(4) = −1.757, P = 0.154, two-tailed paired t-test). Vertical gray line indicates presentation of white noise and shaded region indicates s.e.m. j, Amplitude of evoked response for white noise across 20 presentations for all animals (bold line). Faded lines indicate individual animals (n = 8 animals) and shaded region indicates s.e.m. k, Example traces of axon segments that are responsive to white noise, up-sweeps and down-sweeps. Bold line indicates mean response across 20 presentations; faded traces indicate responses to individual presentations of white noise. Vertical gray line indicates presentation of auditory stimulus. l, Decoding accuracy of multi-class decoder predicting the identity of complex sounds (white noise, up-sweeps and down-sweeps) from population axonal activity. Shaded region indicates s.e.m. m, Pairwise population decoding of white noise, up-sweeps and down-sweeps. D, dorsal; NS, not significant; 2P imaging, two-photon imaging; R, rostral; s, second.
To determine whether the cholinergic transients are sensory responses, we investigated a few alternative explanations. It is possible that these robust transients indicate the detection of novel, unexpected stimuli41,43. If so, we would expect substantial habituation after repeated presentations of the same stimulus. We compared the response of the first five presentations of white noise with that of the last five presentations and found no significant difference in amplitude (P = 0.154; Fig. 1h,i). Across the 20 presentations of the stimulus, the mean amplitude of the evoked response remained relatively constant (Fig. 1j). Even when we presented 110 consecutive neutral white noise stimuli (100 ms at 70 dB SPL, intertrial interval = ~3.3 s), the sensory response remained (Extended Data Fig. 3), indicating that it is a nonhabituating response that is not driven by novelty. Another possibility is that the phasic transients arise due to movements of the animal when the auditory stimuli are detected34,37–39. We extracted the precise timing of movements during the recording sessions and found that 81.6% of the evoked signals were not associated with movements during sound onset (Extended Data Fig. 4). Cholinergic axons thus exhibit nonhabituating phasic transients that are time-locked to stimulus presentation, a hallmark of sensory responses.
We further observed that CBF axons displayed different degrees of responsivity to the complex sounds presented (Fig. 1k and Extended Data Fig. 2). Hence, we asked if the cholinergic signals can do more than just convey the detection of an auditory stimulus and instead play a direct sensory role, relaying information about stimulus identity to the auditory cortex. To test this, we trained a linear decoder to predict the identity of the complex sound (white noise, up-sweeps or down-sweeps) from the population activity of all axons. We observed high accuracy of sound-identity decoding well above 80% (chance level = 33.3%) after sound presentation, suggesting that the cholinergic signal is stimulus-specific (Fig. 1l). To further investigate if the decoding is driven by specific stimuli, we tested each pair of complex sounds and observed robust pairwise decoding, suggesting that phasic, cholinergic neuromodulation carries identifying information about individual auditory stimuli (Fig. 1m). Robust stimulus-identity decoding was also evident within individual animals (Extended Data Fig. 5). Taken together, our data argue that the CBF provides a parallel pathway for sensory signals of neutral auditory stimuli to the auditory cortex.
Frequency-specific CBF axonal responses to pure tones
The central auditory system exhibits precise frequency coding that begins in the cochlea and propagates through the feedforward hierarchy to the auditory cortex. Having demonstrated that cholinergic signals also relay auditory information to the auditory cortex, we asked whether CBF axons exhibit similar frequency selectivity. We presented half-octave-spaced pure tones in a pseudo-random order to passively listening animals and recorded sound-evoked phasic responses from individual cholinergic axon segments. We observed that a subset of CBF axons displayed frequency tuning–axon segments responded robustly and reliably to particular frequencies and the response amplitude decreased for frequencies further away from their best frequency (n = 8,952 axon segments; Fig. 2a,b). Many axon segments responded to a broad range of frequencies (Fig. 2c). In a subset of animals, we further measured responses at different sound levels (50, 60 and 70 dB SPL) and observed robust sound-evoked responses even at 50 dB SPL as well as the emergence of characteristic V-shaped tuning curves (Extended Data Fig. 3). Notably, more axon segments responded to the frequencies between 4.8 kHz and 19 kHz compared with frequencies above 19 kHz (Fig. 2d).
Fig. 2 |. Frequency-specific tuning of cholinergic axons.
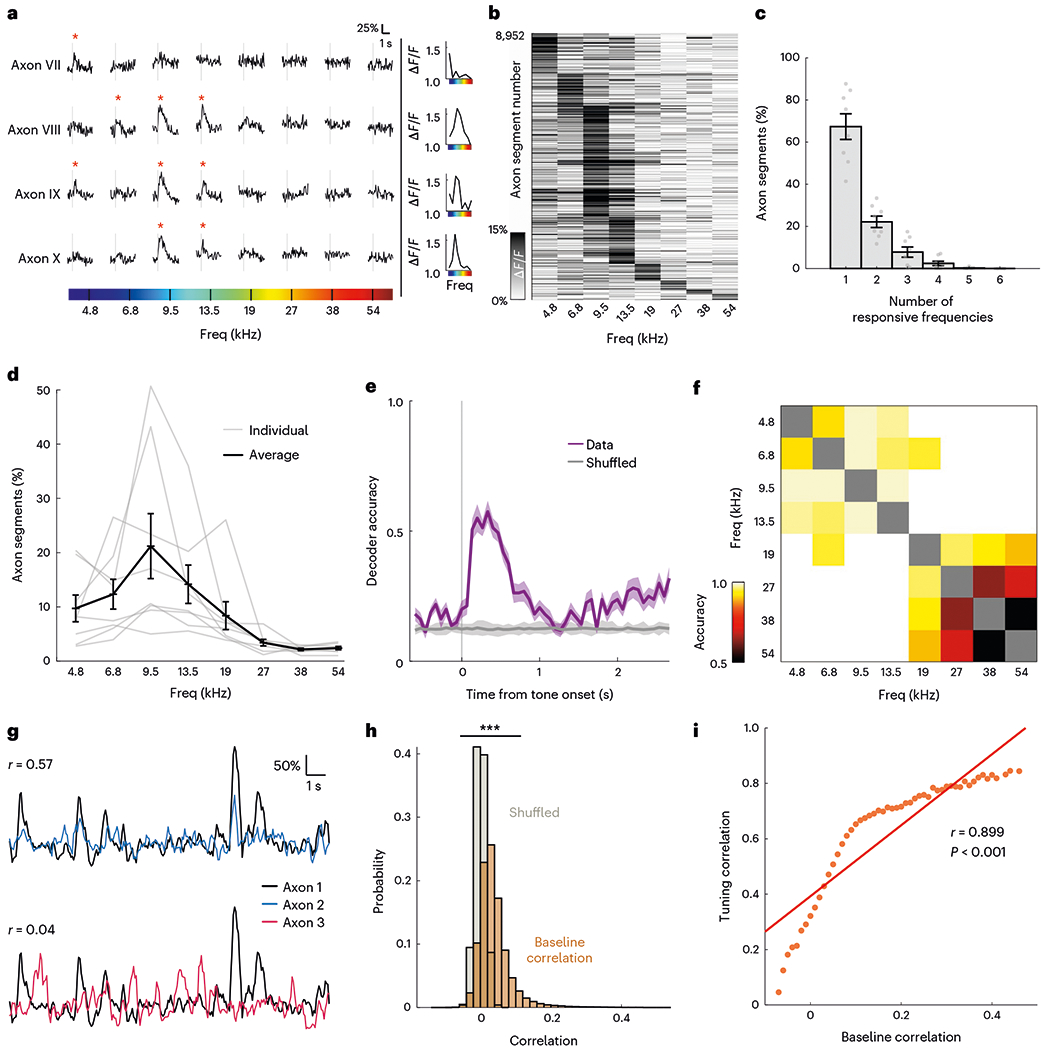
a, Example traces of axon segments with selective evoked responses to pure tones. Vertical gray lines indicate presentation of auditory stimulus and red asterisk indicates significant responses (P < 0.025, right-tailed t-test). Tuning curve for each axon segment is plotted on the right. b, Heatmap of amplitude of evoked response to pure tones in responsive axon segments (n = 8,952). c, Proportion of responsive axon segments that respond to various numbers of pure tones for all animals (n = 8). Error bars indicate s.e.m. d, Proportion of sound-responsive axon segments that responded to each pure tone for all animals (n = 8). Error bars indicate s.e.m. e, Decoding accuracy of multi-class decoder predicting the identity of pure tone presented from population axonal activity. Shaded region indicates s.e.m. f, Pairwise population decoding of eight pure tones presented. g, Example traces of axon segment pairs with high baseline correlation (top) and low baseline correlation (bottom). h, Histogram of Pearson’s correlation coefficient of baseline correlation between axon segment pairs (orange) compared with shuffled data (gray) (D = 0.554, P < 0.001, two-sample Kolmogorov–Smirnov test). i, Pearson’s correlation between axonal tuning correlation and mean baseline correlation in each baseline correlation bin (red line; r(51) = 0.899, P < 0.001). Freq, frequency.
Given the observed heterogeneity in CBF axonal responses to pure tones, we asked whether cholinergic signals carried information about the frequency of auditory stimuli. Using a similar approach to that described above, we trained a multi-class decoder on the eight pure tones and found that tone identity could be decoded well above 50% accuracy (chance level, 12.5%) after tone presentation (Fig. 2e). Pairwise decoding of all stimulus pairs revealed that there is robust pairwise decoding for tones in the low-to-mid frequency of the mouse hearing range, suggesting that cholinergic transients carry information about those frequencies (Fig. 2f). Robust stimulus-identity decoding was also evident in individual animals (Extended Data Fig. 5).
We then asked if similarity in axonal tuning can be predicted by proximity and/or functional connectivity between axon segments. We found that tuning similarity (‘tuning correlation’) did not depend on interaxon distance (r(59) = −0.004, P = 0.976; Extended Data Fig. 6). Next, we investigated if functional connectivity is a better predictor of tuning correlation. We reasoned that if axon segments are functionally connected–either because they stem from the same parent neuron, or from different neurons that share similar inputs–they will have higher correlation in spontaneous activity44,45. We estimated connectivity between pairs of axon segments as the correlation of cholinergic activity outside of the sound-response window (‘baseline correlation’; Fig. 2g,h). Interestingly, baseline correlation is highly predictive of similarity in axonal tuning to pure tones (r(51) = 0.899, P < 0.001; Fig. 2i), suggesting that axon segments that are functionally connected have more similar tuning properties. Altogether, our results argue that cholinergic axons display tuning properties that allow them to project a frequency-specific representation of auditory stimuli to the auditory cortex.
CBF axons provide repeated frequency representations across the tonotopic map
Frequency-specific responses of CBF axons give rise to the possibility of a finer topography of functional cholinergic activity in the tonotopically organized auditory cortex. Auditory cortical neurons display a topography of frequency tuning (tonotopy) along the rostro-caudal axis46,47, which presents a powerful basis to compare the organizational specificity of functional cholinergic tuning. We used two-color, two-photon microscopy of CBF axons and cortical neurons to investigate how the frequency tuning of cholinergic projections to L1 and L2/3 of the primary auditory cortex relates to the underlying cortical tonotopy. First, we expressed axon-GCaMP6s in CBF neurons of ChAT-cre mice which also expressed the red fluorescent calcium indicator, jRGECO1a, in auditory cortical neurons (see Methods). Using two-photon microscopy, we next identified cholinergic axon segments (green, axon-GCaMP6s) innervating the primary auditory cortex (red, jRGECO1a) (Fig. 3a,b, example animal ‘mse012’). We quantified the change in best frequency of these axon segments and observed no significant changes along the rostro-caudal axis (Fig. 3c,d, example site). This is in stark contrast with the striking tonotopic gradient found in cortical neurons in the primary auditory cortex recorded in animals expressing a similar calcium indicator (GCaMP6f) in auditory cortical neurons (Fig. 3e and Extended Data Fig. 7). These data suggest that cholinergic axons display minimal tonotopy compared with cortical neurons in the superficial layers of the primary auditory cortex.
Fig. 3 |. Frequency tuning of cholinergic axons is uncoupled from tuning of cortical neurons.
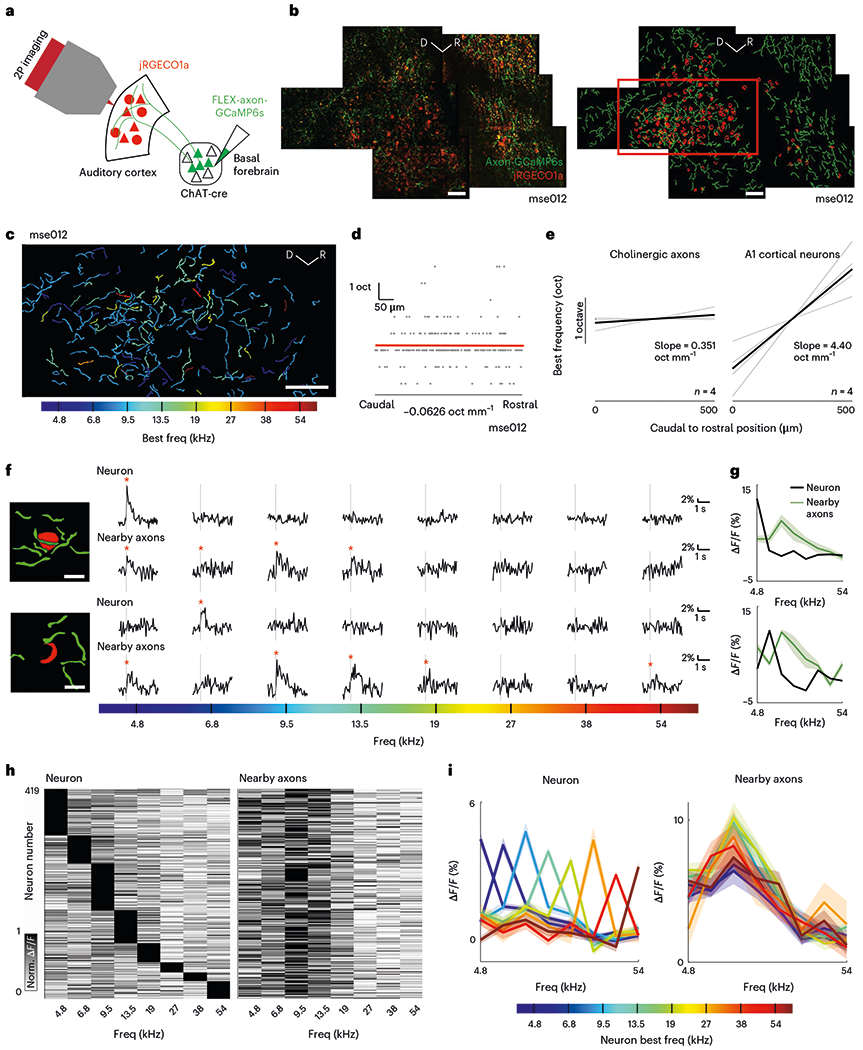
a, Schematic of CBF projection to the auditory cortex and imaging strategy. b, Left, mean composite fluorescence image of cholinergic axons (green) and cortical neurons (red) in example animal ‘mse012’. Composite images were constructed for four sites in three animals. Right, manually identified axon segments (green) and neurons (red). Only responsive ROIs are shown. Red box indicates location of field-of-view in c. Scale bar, 50 μm. c, Axon segments colored by their best frequencies. Scale bar, 50 μm. d, Progression of best frequency of axon segments in c along the rostro-caudal axis. Each gray dot indicates the best frequency of an axon segment in frequency space (y axis) projected onto the rostro-caudal axis (x axis). Slope of line of best fit (red line) reflects progression of best frequency. e, Comparison of progression of best frequency for axon segments (n = 4 sites) and for neurons in primary auditory cortex (n = 4 sites). f, Left, schematic of example neurons and nearby axon segments. Scale bar, 10 μm. Right, mean evoked response of neuron and nearby axon segments to pure tones. Vertical gray line indicates presentation of auditory stimulus and red asterisk indicates significant responses (P < 0.025, right-tailed t-test). g, Frequency tuning curve of example neurons (black) and nearby axon segments (green) in f. Shaded region indicates s.e.m. h, Left, normalized evoked response to pure tones of cortical neurons (n = 419 neurons). Right, normalized mean evoked response to pure tones of the nearby axon segments of the neuron in the corresponding row of the left heatmap. i, Left, mean tuning curves of cortical neurons grouped by their best frequency. Right, mean tuning curves of the nearby axon segments of cortical neurons grouped by best frequency of cortical neurons. Shaded region indicates s.e.m. Norm., normalized; oct, octave; Freq, frequency.
Despite the minimal tonotopy, it is possible that the responses of local axon segments may overlap with the preferred frequencies of adjacent auditory cortical neurons. Hence, we compared the tuning of auditory cortical neurons and their nearby cholinergic axons directly. We identified 419 tone-responsive cortical neurons and their respective nearby axon segments in six animals (Fig. 3b, example animal ‘mse012’). We found many single-peak neurons that were tuned to particular frequencies as expected (Fig. 3f,g). Interestingly, local axon segments were not co-tuned with the cortical neuron (Fig. 3f,g), but were instead responsive to a wider range of frequencies (Fig. 3h). When we compared the tuning profile of auditory cortical neurons with their nearby axons, we observed that, regardless of the tuning of the cortical neuron, the local cholinergic axon segments responded most to frequencies between 4.8 kHz and 19 kHz (Fig. 3i). In contrast, the tuning of nearby cortical neurons was more similar (Extended Data Fig. 8). These data reveal that the sensory information relayed by CBF axons is largely uncoupled from cortical neuronal tuning, thereby providing a scaffold for interactions between parallel streams of sensory information to the auditory cortex.
The auditory thalamus sends auditory information to the CBF
Our finding that cholinergic axons relay auditory information to the cortex raises the question of where along the ascending auditory pathway is the source of auditory information to the CBF. Previous anatomical studies have provided a roadmap for understanding where this input arises. In particular, the CBF receives innervation from the neocortex, including the auditory cortex, and the thalamus including the MGB (‘auditory thalamus’)4,5,24–26. We first investigated whether the auditory thalamus relays auditory information to the CBF. We performed chemogenetic suppression of the entire auditory thalamus using the inhibitory designer receptor exclusively activated by designer drugs (DREADD) hM4Di and examined its effect on the tuning response of cholinergic axons in the auditory cortex (n = 4 animals; Fig. 4a). Consistent with the findings above, cholinergic projections to the auditory cortex in these animals displayed robust evoked responses to pure tones (Fig. 4b,c). Intraperitoneal injection of clozapine N-oxide (CNO) suppressed activity in the MGB only in animals expressing hM4Di DREADD, which we confirmed by observing attenuated sound-evoked responses in cortical neurons (Extended Data Fig. 9). MGB suppression resulted in marked reduction of percentage of responsive CBF axons (after saline injection: 59.9 ± 11.2%, after CNO injection: 37.3 ± 18.0%, P < 0.05) and a significant attenuation of sound-evoked CBF axonal responses (F(1,48) = 27.67, P < 0.001; Fig. 4b–d).
Fig. 4 |. Suppression of auditory thalamus but not auditory cortex attenuates sound-evoked cholinergic responses.
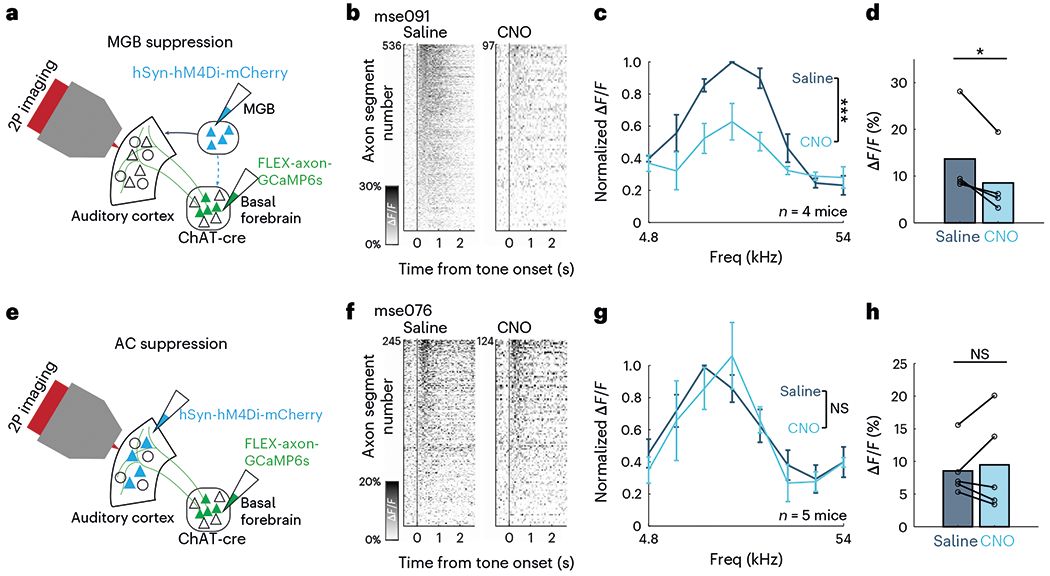
a, Schematic of injection strategy for suppression of the MGB using hM4Di DREADDs. b, Evoked responses in cholinergic axon segments to most responsive frequencies (9.5–19 kHz) after intraperitoneal saline (left) and CNO injection (right) for an example animal, ‘mse091’. c, Normalized evoked response to pure tones after intraperitoneal saline and CNO injection (n = 4 animals). Evoked response is significantly attenuated after CNO injection (F(1,48) = 27.67, P < 0.001, two-way ANOVA). Error bars indicate s.e.m. d, Mean evoked response to most responsive frequencies (t(3) = 3.49, P < 0.05, two-tailed paired t-test; n = 4 animals). e, Schematic of injection strategy for suppression of the auditory cortex using hM4Di DREADD. f, Evoked response in cholinergic axon segments to most responsive frequencies (9.5–19 kHz) after intraperitoneal saline (left) and CNO injection (right) for an example animal, ‘mse076’. g, Normalized evoked response to pure tones after intraperitoneal saline and CNO injection (n = 5 animals). Evoked response is not attenuated after CNO injection, (F(1,64) = 0.01, P = 0.908, two-way ANOVA). Error bars indicate s.e.m. Freq, frequency. h, Mean evoked response to most responsive frequencies (t(4) = −0.555, P = 0.608, two-tailed paired t-test; n = 5 animals).
It is also possible that the auditory thalamus relays information to the basal forebrain through the auditory cortex. To test that possibility, we chemogenetically suppressed the auditory cortex while recording cholinergic axonal response to pure tones (n = 5 animals; Fig. 4e). Intraperitoneal injection of CNO attenuated sound-evoked responses in auditory cortical neurons (Extended Data Fig. 9) but did not affect percentage of responsive CBF axons (after saline injection: 50.5 ± 16.8%, after CNO injection: 50.0 ± 35.6%, P = 0.958) or sound-evoked responses of CBF axons (F(1,64) = 0.01, P = 0.908), suggesting that the auditory cortex plays a minimal role in auditory information relay to the basal forebrain (Fig. 4f–h). These data together point to the auditory thalamus as a major source of auditory input to the CBF.
Tonic cholinergic activity modulates phasic responses
The classic view of cholinergic neuromodulation proposes that the slow, diffuse signals from the CBF reflect brain and behavioral states27–32. However, it is unknown how these tonic signals affect phasic transients from the same cholinergic neurons. We investigated the relationship between phasic sensory-evoked responses and tonic state-dependent activity from the CBF by using our optical approach, which allowed us to detect changes in cholinergic activity at multiple timescales. During our recordings, we observed large endogenous fluctuations of baseline tonic signals, of which 24.6% were associated with a movement within 200 ms of the onset of the change. These tonic fluctuations were highly, but not always, correlated with movement of the animal (P < 0.001; Fig. 5a,b and Extended Data Fig. 5). Tonic cholinergic activity was also highly correlated between axon segments in the same recording session, suggesting that the fluctuations were network-wide (P < 0.001; Fig. 5c–e) rather than in specific subpopulations. These results argue that tonic fluctuations may reflect a global change in behavioral and brain states of the animal. This global change was also present in the baseline activity of the cortical network as we observed a striking, temporally correlated change in baseline cortical and axonal activity, suggesting a coupling between state-level changes in cortical networks and tonic cholinergic neuromodulation (P < 0.001; Extended Data Fig. 10).
Fig. 5 |. State-dependent tonic cholinergic activity modulates sound-evoked cholinergic responses.
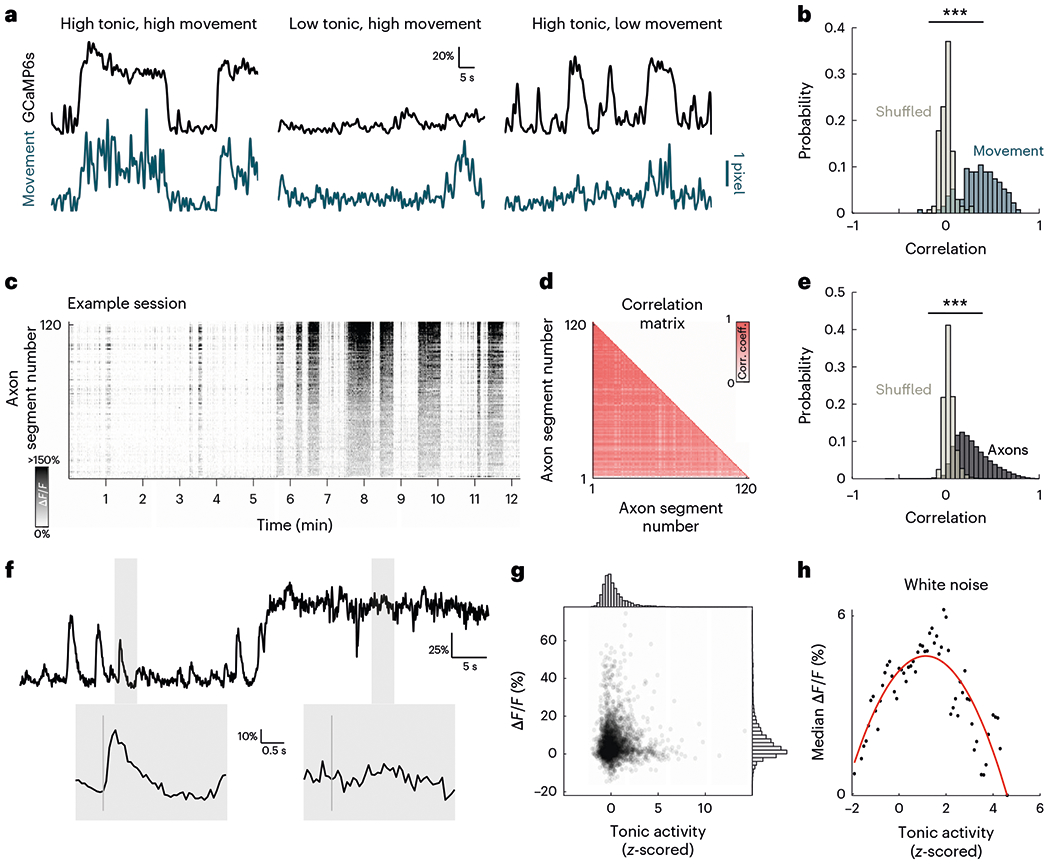
a, Example tonic GCaMP6s fluorescence activity (black) and movement (turquoise). Some high-tonic epochs are associated with movement (left), some movements are not associated with high-tonic epochs (center) and some high-tonic epochs are not associated with movement (right). Scale bar indicates 1-pixel movement. b, Histogram of Pearson’s correlation coefficient of GCaMP6s signal and movement (turquoise) compared with shuffled data (gray) (D = 0.837, P < 0.001, two-sample Kolmogorov–Smirnov test). c, Tonic GCaMP6s signal for all axon segments in example recording site. d, Correlation matrix of tonic activity for all segments in c. e, Histogram of Pearson’s correlation coefficient of axon segments in each recording site (black) compared with shuffled data (gray) (D = 0.727, P < 0.001, two-sample Kolmogorov–Smirnov test). f, Top, example mean fluorescence activity of one recording session showing low and high tonic activity. Shaded regions indicate response windows to white noise. Bottom, evoked response to white noise at low and high tonic activity corresponding to windows highlighted above. Vertical gray line indicates presentation of white noise. g, Scatterplot of mean evoked response to white noise at different tonic cholinergic baselines. Histogram for normalized tonic activity (top) and evoked response (right). h, Median evoked response to white noise across a range of tonic activity. Red line indicates best polynomial fit. Corr. coeff., correlation coefficient; Freq, frequency.
We next investigated how changes in baseline activity modulated sensory-evoked cholinergic responses. We observed that at high-tonic epochs, the mean amplitudes of sound-evoked responses were significantly attenuated (Fig. 5f). Importantly, tonic cholinergic activity was not binary as we observed a continuum of baseline fluctuation. When we compared evoked responses to white noise across this range of baseline cholinergic levels, we found that the amplitude of phasic cholinergic responses increased as tonic cholinergic activity ramped up to an optimal ‘sweet-spot’, and any further increase in tonic cholinergic activity led to a decrease in sound-evoked responses (Fig. 5g,h). Similar modulatory effects of tonic cholinergic activity were observed for pure tones and up- and down-sweeps (Extended Data Fig. 10). These results suggest that network-wide tonic changes in cholinergic activity which are linked to brain and behavioral states strongly modulate stimulus-specific sensory information relayed by phasic cholinergic signals.
Discussion
We systematically characterized sound-evoked responses of CBF projections to superficial layers of the auditory cortex. Using two-photon imaging of cholinergic axonal projections, we observed robust and nonhabituating responses to auditory stimuli widely across L1 and L2/3 of the auditory cortex. Cholinergic sensory responses were not homogeneous, as individual axon segments displayed diverse but stable tuning to complex sounds and pure tones. This heterogeneity allowed us to decode stimulus identity from axonal activity at a population level. Despite the response heterogeneity, cholinergic axonal responses were not tonotopically organized and were largely uncoupled from the tuning of nearby cortical neurons. Chemogenetic suppression also revealed that the auditory thalamus is a major source of auditory information from the ascending auditory pathway, although this could be supplemented by inputs from earlier auditory regions (for example, inferior colliculus or auditory brainstem). Lastly, we observed that endogenous changes in tonic cholinergic activity, reflecting both behavioral and brain states, modulate phasic sensory signaling of the CBF.
Our study demonstrates that sound-evoked cholinergic transients (1) are stably driven by repeated presentation of sounds and not merely associated with novelty or movement, (2) are intrinsically present even in the absence of behavioral conditioning and (3) encode readily the identity of the stimulus. These features argue that the CBF provides a parallel sensory channel to the auditory cortex. Interestingly, despite the heterogeneity and stimulus-specific encoding, cholinergic innervation to L1 and L2/3 of the auditory cortex is not tonotopically organized and is uncoupled from cortical neural tuning. This spatial decorrelation of the separate cholinergic sensory signal and canonical feedforward auditory signal could help calibrate cortical responses and provide a powerful substrate for experience-dependent cortical plasticity. Previous studies have shown that pairing external stimulation of basal forebrain cholinergic neurons with pure tones can induce long-lasting shifts in frequency tuning of cortical neurons16–19, a process achieved through the disinhibition of microcircuits by acetylcholine18,19. Our demonstration that cholinergic projections to the auditory cortex display intrinsic sensory responses that overlap temporally with cortical neuronal responses may provide an ecologically plausible mechanism for cortical plasticity based on sensory information from the environment. Notably, the decorrelation in tuning provides repeated representations of a broad range of sound stimuli at all points on the cortical tonotopic map, allowing cortical neurons to receive cholinergic inputs at frequencies outside of their best frequencies. This parallel channel could enable shifts in cortical tuning to behaviorally relevant stimuli and may be particularly powerful at the shoulders of a neuron’s tuning curve.
We note that the lack of tonotopy in cholinergic projections to superficial layers of the auditory cortex does not preclude a tonotopic organization in the CBF. It is possible that tonotopic organization exists in afferent connections from auditory regions (for example, from the MGB) to the CBF but is relayed as repeated multiplexed signals to downstream regions due to the projection architecture of the CBF. Furthermore, it remains possible that there are laminar differences in axonal tonotopy which could be due to laminae-specific cholinergic output–the CBF sends strong projections to both superficial (L1/2/3) and deep (L5/6) cortical layers with varying degrees of innervation in L4 (ref. 48–50)–and/or variability in receptor distribution on downstream cortical neurons50,51. More broadly, our work builds on current anatomical studies to demonstrate a functional sensory pathway from the MGB to the auditory cortex through the CBF. However, suppression of MGB activity did not completely attenuate cholinergic auditory responses, indicating that there are other direct or indirect pathways from the auditory system to the CBF. Detailed anatomical and functional studies will be needed to fully dissect the extent to which lower auditory regions (including inferior colliculus, the auditory brainstem and even the cochlear nucleus) send projections to the CBF.
A particularly interesting observation is that while CBF axon segments exhibit no evidence of tonotopy, they do appear to have a core tuning in the low-to-mid frequency of the mouse hearing range (4.8–19 kHz). One possibility is that this tuning arises from direct experience; the responsivity of the CBF may be tied to the acoustic statistics of the environment. (While laboratory mice housed in animal facilities can communicate with ultrasonic vocalizations, much of their acoustic experience falls within the low-to-mid frequency range52,53.) Future experiments that alter the statistics of the acoustic environment throughout development can help test this hypothesis. Another possibility is that the core CBF tuning developed on a longer timescale due to evolutionary pressures. The CBF has been shown to be critical for multiple cognitive processes—including attention, arousal and learning. Hence, it is possible that this parallel channel of auditory signaling evolved to be intrinsically tuned to frequencies that convey important information from the environment for these processes, while also being adaptive to learned salient cues.
Our work also calls into question the classic dichotomy between phasic and tonic modes of neuromodulation22,23. The cognitive role of acetylcholine has traditionally been considered from a slow, spatially diffuse perspective based on a canonical volume transmission. Recent studies using modern experimental techniques, however, have revealed that cholinergic activity operates at multiple timescales through a more region-specific functional architecture6,31,42,54. Our results argue that different timescales of cholinergic activity interact in the CBF—slow cholinergic signals which indicate brain and behavioral states have profound effects on fast, sensory-evoked cholinergic transients. The interaction between different modes of cholinergic signaling potentially follows a classical Yerkes–Dodson inverted-U relationship28,55 in which phasic sensory signals are attenuated when tonic baseline cholinergic level is too low or too high, such as when the animal is overly aroused, locomoting or disengaged. Our study also adds to recent work reporting that behaviorally relevant stimuli (either intrinsically appetitive/aversive or learned through experience) gain CBF responses33,35,36,40. Our finding suggests that this ‘gain’ could be operating on pre-existing sensory responses that are amplified to influence computations in cortical and subcortical targets. The exact nature of the multiplexing in the CBF and how cortical targets read out these distinct information streams are exciting directions for future exploration.
In sum, our results suggest that the CBF is a self-regulating multiplexer, receiving sensory or task-relevant information, modulating it based on the state of the animal and sending an integrated combination of fast and slow signals to downstream targets. The superposition of each information channel may underlie the functional role of cholinergic neuromodulation. Our findings serve to expand current theoretical models on the role of the CBF in learning, task engagement and decision-making, and to lay the groundwork for future investigation of the behavioral relevance of sensory cholinergic neuromodulation.
Methods
Animals
All procedures were approved by Johns Hopkins University Animal Care and Use Committee. Male and female transgenic mice (ChAT-cre, ChAT-cre/jRGECO1a) between 6 and 16 weeks were used for the experiments. All experiments (passive recording and chemogenetic suppression) used ChAT-cre mice unless stated otherwise (Supplementary Table 1). ChAT-cre mice were obtained from the Jackson Laboratory (stock no. 006410) and bred in-house. ChAT-cre/jRGECO1a mice were bred in-house by crossing homozygous female ChAT-cre mice and hemizygous male jRGECO1a mice obtained from the Jackson Laboratory (stock no. 030526). Offspring genotypes were confirmed by PCR (Lucigen EconoTaq Plus GREEN 2X). Both heterozygous and homozygous ChAT-cre/jRGECO1a mice were used in the experiments and no phenotypic difference were observed.
Surgical procedures
Mice were anesthetized with isoflurane (2.0% during surgery) and their body temperature was maintained at 35–37 °C throughout the surgery. For all surgeries, a 3-mm craniotomy was performed over the temporal lobe (centered 1.75 mm anterior to the lambda structure on the ridge line) to expose the auditory cortex. In a subset of ChAT-cre animals (n = 4), which do not endogenously express jRGECO1a in cortical neurons, an adeno-associated virus (AAV) vector encoding the calcium indicator jRGECO1a56 (~0.8–1.5 μl, AAV1-syn-jRGECO1a, addgene) was injected in L2/3 in the left auditory cortex to express the calcium indicator in auditory cortical neurons. Expression of viral jRGECO1a was confirmed with two-photon microscopy. A 3-mm circular glass window (Warner Instruments) was secured in place over the exposed brain with a dental cement and Krazy Glue mixture. For all surgeries, we carefully leveled the head of the animal and drilled a small burr hole above the basal forebrain (anterior-posterior (AP), −0.5 mm; medial-lateral (ML), 1.8 mm; dorsal-ventral (DV), 4.5 mm from bregma), and an AAV vector encoding the calcium indicator axon-GCaMP6s (1 μl, AAV5-hSynapsi n1-FLEx-axon-GCaMP6s, addgene) was injected into the basal forebrain to express GCaMP6s in cholinergic neurons and their axonal projections. In animals used for chemogenetic suppression experiments, the inhibitory DREADD hM4Di packaged into an AAV (0.8 μl, AAV5-CaMKIIa-hM4D(Gi)-mCherry, addgene) was injected into the left MGB (n = 4 animals; AP: −3.2 mm; ML: 1.9 mm; DV: −3.5 mm) or the left auditory cortex (n = 5 animals; 1.75 mm anterior to the lambda structure on the ridge line), respectively. All injections were done using a Hamilton needle (Hamilton Company, 34 gauge, 25.4 mm, 12-degree bevel) and syringes (Hamilton Company, 1700 series, 5-μl capacity), and a microinjection pump (Harvard Apparatus) at a flow rate of 0.60–0.75 μl min−1. For injections in the basal forebrain, the injection needle was left in place for at least 5 minutes (min) following infusion to reduce backflow. Finally, a custom-made stainless steel headpost was affixed to the exposed skull with C&B Metabond dental cement (Parkell) and animals were allowed to recover for at least 3 weeks before imaging.
Data acquisition using two-photon microscopy
Imaging was performed using a two-photon resonant-scanning microscope (Neurolabware) equipped with a ×16 objective (Nikon). To image in the auditory cortex, the objective was tilted to an angle of 50–60° such that it was perpendicular to the brain surface. Two-photon fluorescence of axon-GCaMP6s and jRGECO1a was excited at 980 nm using an Insight X3 laser (SpectraPhysics). We also used an electronically tunable lens to record near-simultaneously in L1 (60–100 pm below dura) and L2/3 (150–200 μm below dura) in sites that contained axonal segments (312 χ 192 μm2 area, frame rate 31.92 Hz overall, 15.96 Hz per plane, laser power ≤ 40 mW). As we did not observe significant differences in sound-evoked axonal response between the two layers, data across the two layers were grouped together for analysis.
To record timeseries of sound-evoked axonal activity, awake animals were head-fixed under the microscope and a speaker was placed adjacent to the animal (microphone-to-ear distance ~ 5 cm). Animals were presented with a set of 11 auditory stimuli consisting of eight pure tones (70 dB SPL, 4.8–54.8 kHz, half-octave intervals, 100 ms, 10-ms cosine on/off ramps) and three complex sounds (70–80 dB SPL, white noise, frequency-modulated up-sweep (4–64 kHz) and down-sweep (64–4 kHz), 100 ms). Additional control experiments used the same stimuli set at 50 dB SPL and 60 dB SPL. Auditory stimuli in the set were presented in a pseudo-random order with ~3.3-s interval between sounds, and the stimuli set was repeated 20 times during each imaging session. Scanner noise was attenuated to 40–50 dB SPL using a custom-made foam sound enclosure directly surrounding the animal. Images were collected at ×2 and ×4 magnification using ScanBox software (Neurolabware) and motion-corrected with Suite2p57. A widefield vasculature image was also taken at each imaging site to help with multi-site alignment (see below).
ROI identification and calculation of evoked responses
To select ROIs, we manually identified axon segments and cells with ImageJ (NIH) from mean fluorescence reference images of each field-of-view. Extra caution was taken to avoid ambiguous structures (for example, single bouton was not selected unless it was by the way of an axon segment to avoid confusion with fluorescent debris). Single observable axon tracts were kept intact to the best of our ability to avoid oversampling from the same segment, with an exception being when multiple axon segments intersected. As it was often difficult to disambiguate from the two-dimensional projection image three-dimensional branching of the axons, we erred on the side of caution and separated axons into multiple segments at intersections. Only sessions that were visually inspected to contain clear axons were used in the analysis. Subsequently, we extracted the timeseries of axonal and neuronal fluorescence activity from the ROIs using custom functions written in MATLAB.
For each presentation of auditory stimulus, we calculated ΔF/F of the sound-evoked response as the ratio of mean fluorescence in duration-matched response windows before and after tone presentation. ROIs were determined to be responsive to a particular stimulus if their evoked responses showed a significant increase across 20 presentations of the same stimulus (α = 0.025, right-tailed paired t-test).
Imaging site alignment and quantification of tonotopy
To align multiple sites in each animal, pixel-wise x and y offsets between each imaging site were measured by manually overlaying and comparing vasculature images using Photoshop v.14.0 (Adobe). These offset values were used in a custom MATLAB function to stitch the vasculature and two-photon images together. For analysis of axonal tonotopy in the primary auditory cortex, the primary auditory cortex was located by analyzing cortical neuronal (jRGECO1a) responses to identify imaging sites with tone-responsive neurons. These sites contained neurons that were tuned to auditory stimuli and displayed tonotopy expected from primary auditory cortex58 (example sites in Supplementary Fig. 1). The relative positions of axon segments in the primary auditory cortex along the rostro-caudal axis were obtained from the stitched image and plotted against their most responsive frequency. Tonotopy is operationalized as the change in best frequency of cholinergic axon segments along the rostro-caudal axis. To compare tonotopy between cholinergic axons and cortical neurons, size-matched areas of primary auditory cortex were identified in animals expressing the same family of calcium indicator (GCaMP6f) in excitatory cortical neurons. These animals underwent the same surgical process described above but received viral injection of GCaMP6f (1 μl, AAV9-CamKII-GCaMP6f, addgene) in the same coordinates in the auditory cortex and did not receive axon-GCaMP6s injection in the basal forebrain. The primary auditory cortex was located in these animals by identifying the region with an increasing change in best frequency along the rostro-caudal axis as described in previous studies22. Tonotopy of cortical neurons was quantified as described above.
For comparison of tuning between axon segments, we quantified ‘tuning correlation’, ‘baseline correlation’ and interaxon distance between all pairs of sound-responsive axons in the same imaging site. ‘Tuning correlation’ was calculated as the Pearson’s correlation between evoked response to eight presented pure tones. ‘Baseline correlation’ was calculated as the Pearson’s correlation between fluorescence activity of the entire recording session after removing the activity during the sound-response window (0–200 ms after stimulus presentation) to prevent sound-evoked responses from driving the effect. For the analysis in Fig. 2i, baseline correlations were grouped in bins of 0.01 and only bins with more than 100 data points were used. Distance between each axon segment was calculated as the Euclidian distance between the centroids of the ROIs in the same imaging site. For the analysis in Extended Data Fig. 6, interaxon distance was grouped in bins of ~4 μm and only bins with more than 100 data points were used. As only 6.6% of the sites recorded had axon segments that were more than 600 pixels (~235 μm) apart, analysis was limited to axons less than 600 pixels apart to reduce representation bias from those sites. For comparison of cortical and axonal tuning, ROIs within 20 μm were considered as ‘nearby’. As we were unable to accurately determine the z offset between each imaging site, cortical neurons and nearby axon segments and neurons used were limited to within each imaging site. Tuning correlation and distance between ROIs were quantified with the same methods described above. To improve signal-to-noise ratio for analysis comparing tuning of cortical neurons and nearby cortical neurons, analysis was restricted to cells with evoked response greater than the noise ceiling (97.5th percentile of all fluorescence activity).
Tonic cholinergic modulation of sound-evoked response
For tonic activity correlation analysis, a lowpass filter (passband frequency = 0.5 Hz) was applied to the raw fluorescence trace and the movement signal. Pearson’s correlation coefficient was calculated for the relevant filtered timeseries (axon–axon, axon–cell, axon-movement) using the entire session. Shuffled data were constructed from the same timeseries which was circularly shifted by 500 or 1,000 frames. Movement was quantified using the x–y offset of the motion-corrected image. The x–y offset was extracted using Suite2p and the amplitude of movement signal was calculated as the absolute difference of the Euclidean norm of x and y offset for each successive frame. We validated the efficacy of x–y offset in capturing movement using videography of facial movement during two-photon imaging in five mice. We performed pose estimation using DeepLabCut59 to identify movement in the left face patch of the animal and correlated it to unfiltered x–y shifts in image registration. We found that DeepLabCut-identified movements (for example, jaw movement, nose twitches and blinking) and x–y shifts were significantly correlated across all tested mice (Extended Data Fig. 4). To quantify tonic fluctuations that were closely coupled with movement, changes in tonic activity and movement were digitized using respective thresholds. The tonic threshold was defined as 2 median absolute deviations above median tonic activity of each recording session; the movement threshold was defined as x–y offset greater than 1 pixel. Tonic epochs were labeled as closely coupled with movement if onset of movement occurred within 200 ms of change in tonic activity. Processed data were visually inspected to validate the appropriateness of the chosen thresholds. To compare tonic cholinergic activity across imaging sessions and animals, fluorescence of each session was standardized by subtracting the median and dividing this difference by the median absolute deviation. This method of standardization was adopted as we observed a wide range of baseline tonic activity which could not be digitally classified into ‘low’ and ‘high’. On this interval scale, the median level of tonic activity is designated ‘0’, whereas low tonic epochs are negative and high-tonic epochs are positive. This allowed us to compare tonic cholinergic activity without setting an arbitrary ‘tonic floor’. For the analysis in Fig. 5h, tonic activity was grouped in bins of 0.1 a.u. and only bins with more than five data points were used.
We validated that fluctuation in tonic fluorescence signal was not just an artifact of movement by testing whether there was an increase in fluorescence variance during movement bouts. We observed no increase in the variance of the fluorescence signal, and, instead, we often observed a significant decrease in variance. We also found that there was significantly more variance in the recorded movement than in the fluorescence signal. These data helped rule out that a z-motion artifact was contaminating our signal (Supplementary Fig. 2). Additionally, to rule out the possibility that increases in fluorescence intensity were a result of axon segments entering and exiting the plane of focus, we quantified the distribution of ΔF/F of individual axon segments during movement epochs (described previously30,60). If changes in fluorescence arise from axon segments entering and exiting the plane of focus during motion, then we would expect there to be a similar proportion of positive and negative deflections in ΔF/F as axon segments are equally likely to enter or exit the plane of focus. However, we found that the distribution was heavily right-skewed, suggesting an overall increase in fluorescence during movement epochs that is unaccounted for by z-motion artifacts (Supplementary Fig. 2). Lastly, we validated that GCaMP signal is not saturated at higher tonic levels. We calculated an event probability index using all trials of all responsive axon segments, which quantified the percentage of trials in each tonic bin that contained a fluorescent event (defined as a transient increase with ΔF/F greater than the bootstrapped mean of all sound-evoked responses) that was either tied to stimulus presentation (‘sound-evoked’) or not (‘spontaneous’). If it is the case that the GCaMP fluorescence is saturated under high-activity conditions, we would expect the event probability for both types of events to converge. However, we found that event probability was greater for spontaneous events than for sound-evoked events at all tonic levels, suggesting that there are still transient increases in fluorescence even at the highest tonic levels, and that they are just not tied to stimulus presentation (Supplementary Fig. 2).
Multi-stimuli decoding
For multi-class decoding, we used a Gaussian naive Bayes classifier with uniform prior to classify calcium activity into multiple stimulus classes. Probability distributions were estimated from labeled data points in each class and a new datum was classified by estimating the posterior probability for each class and assigning it to the class with the maximum probability. We trained the frame-by-frame decoder using frame-by-frame raw fluorescence values of all axon segments for 19 presentations of the three complex sounds or eight pure tones and tested the decoder on a left-out trial. We validated stimulus-decoding accuracy with a 20-fold cross-validation. Shuffled data were constructed from the same fluorescence data but the label for tone identity was randomized. The 95% confidence interval for shuffled data was calculated by iterating the classification of shuffled data 100 times and taking the values of the 2.5th and 97.5th percentiles. To investigate if performance of the linear decoder was driven by high decoding accuracy of specific tones, we conducted pairwise decoding using the same Gaussian naive Bayes classifier applied to every pair of auditory stimuli (complex sounds or pure tones). We trained the decoder on mean fluorescence values in the maximally decodable window (3–7 frames after tone presentation as determined by the previous analysis). To test the robustness of our decoding, we trained our decoders with population activity from all axon segments and tested their decoding accuracy while removing the top nth percentile of the most influential axon segments (sorted based on the size of the weights). We further examined decoding accuracy per animal by training the frame-by-frame and pairwise decoders on responsive axon segment activity in six animals with more than 100 responsive axon segments.
Chemogenetic suppression
Mice expressing inhibitory DREADD hM4Di first received 10 ml kg−1 intraperitoneal injections of saline. At 15 min after saline injection, the animals were placed under the two-photon microscope and activity of cholinergic axonal projections to the auditory cortex was recorded in a similar protocol to that described above. At the end of the imaging session, animals were removed from head-fixation 5 min before receiving intraperitoneal injection of 0.5–3 mg kg−1 CNO. Volumes of saline and CNO injections were matched. At 15 min after CNO injection, the animals were placed back under the two-photon microscope and activity of cholinergic axonal projections to the auditory cortex was again recorded. Efforts were made to image the same axons for saline and CNO injections. At the end of the experiment, a subset of mice were perfused for immunohistochemistry to determine the expression of hM4Di. Recording sessions for saline and CNO injections were aligned and preprocessed separately and the responses of cholinergic axon segments were quantified as described above. The main effect of CNO injection was quantified using two-way analysis of variance (ANOVA) (Type II SS). Analyses comparing mean evoked responses after saline and CNO injection were limited to 9.5–19 kHz, as these tones elicited evoked responses in the cholinergic axons in the imaging sites following saline injection.
To verify that CNO injection suppressed the MGB and auditory cortex in mice expressing hM4Di in the respective areas, control experiments were conducted. ChAT-cre mice received GCaMP6f injection in the auditory cortex (1 μl, AAV9-CamKII-GCaMP6f, addgene) and hM4Di injection in either the MGB or auditory cortex as described above. We targeted the entire MGB in our experiments and efficacy of DREADD expression in all three subdivisions was verified visually (example sites in Supplementary Fig. 3). At 3 weeks after injections, chemogenetic suppression protocols described above were conducted and cortical responses to auditory stimuli were recorded following intraperitoneal saline and CNO injections. Control experiments to assess the effects of CNO metabolism were conducted in ChAT-cre mice expressing axon-GCaMP6s without hM4Di DREADD using the same experimental and analysis protocols outlined above. Preprocessing and quantification of cortical responses were performed as described above. Analyses comparing mean evoked responses after saline and CNO injection were limited to 9.5–19 kHz for the MGB suppression condition, 4.8–19 kHz for the auditory cortex suppression condition, and 4.8–27 kHz and 54 kHz for CNO injection without the DREADD condition, as these tones elicited evoked responses in the cortical neurons in the imaging sites following saline injection, as determined by post hoc Tukey’s honestly significant difference test.
Histology
To confirm the specific expression of axon-GCaMP6s in basal forebrain cholinergic neurons following injection in ChAT-cre mice, we performed immunohistochemistry with ChAT and GFP antibodies. We also performed histological analysis (without antibodies) to confirm the expression of inhibitory DREADD hM4Di (which expresses an mCherry fluorescence marker) in neurons in the MGB and auditory cortex, respectively.
Mice were deeply anesthetized and transcardially perfused with ~20 ml of PBS solution followed by ~20 ml of 4% PFA. Brains were then extracted from the skull and postfixed in 4% PFA overnight at 4 °C before transfer to 30% sucrose solution for 2–3 d at 4 °C. Next, the brains were frozen in tissue tek O.C.T. compound (Sakura Finetek) at 80 °C for multiple days to prepare for slicing. Frozen brains were sliced coronally with 35-μm thickness on a cryostat and permeabilized for 15 min with 0.3% PBS-Triton (PBS solution with 0.3% Triton X-100 (Sigma Aldrich)). Slices were incubated for 1 h in a blocking buffer containing 0.3% PBS-Triton and 10% Normal Donkey Serum (Synaptic Systems). Slices were then transferred to fresh 0.3% PBS-Triton and incubated overnight at 4 °C with appropriate primary antibodies (1:100–500 dilution of goat anti-ChAT IgG, Millipore, AB114P; 1:500 rabbit anti-GFP IgG, Abcam, ab6556, or 1:300 rabbit anti-GFP IgG, ThermoFisher, A-6455 (both anti-GFPs had similar levels of expression)). Afterwards, slices were washed in PBS solution and incubated for 1 h at room temperature with secondary antibodies (1:500 Cy 3 AffiniPure Donkey Anti-Goat IgG, Jackson ImmunoResearch, 705-165-147; 1:500 Alexa Fluor 488 AffiniPure Donkey Anti-Rabbit IgG,Jackson ImmunoResearch, 711-545-152). Finally, slices were rinsed in PBS solution and incubated at room temperature in DAPI Fluoromount-G (Southern Biotech) before being mounted onto glass slides and coverslipped for imaging.
Images for cell counting were acquired using a ×20 air objective on a Zeiss LSM 700 Confocal Microscope using Zeiss Zen microscopy software (Carl Zeiss), from the basal forebrain, for axon-GCaMP6s immunohistochemistry. Cell counts were performed manually in ImageJ (NIH). Coronal slice images were acquired using a ×10 air objective on a Zeiss LSM 700 Confocal Microscope using Zeiss Zen microscopy software (Carl Zeiss). The basal forebrain, medial geniculate nucleus and auditory cortex were located using coordinates from the Allen Brain Atlas and references from other studies40,41.
Statistical analysis
All statistical analyses were performed in MATLAB (MathWorks). All data are presented as mean ± s.e.m (standard error of the mean). unless otherwise indicated. Statistical significance was defined as P< 0.05 unless otherwise indicated.
Reporting summary
Further information on research design is available in the Nature Portfolio Reporting Summary linked to this article.
Extended Data
Extended Data Fig. 1 |. Immunohistochemistry for cre-dependent cholinergic neurons targeting.
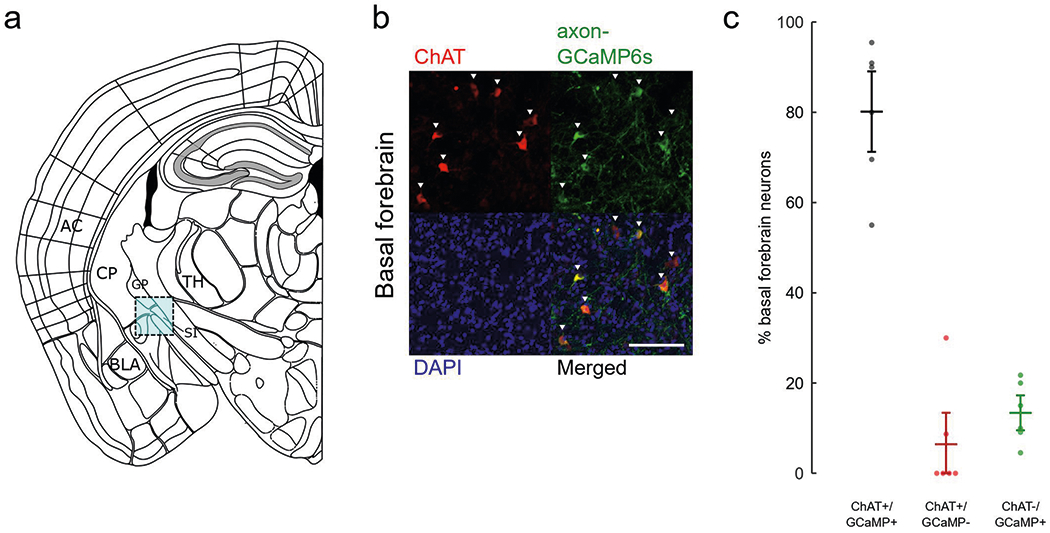
a, Schematic of imaging site for basal forebrain (cyan box) adapted from Allen Mouse Brain Coronal Atlas. AC, auditory cortex; BLA, basolateral amygdala; CP, caudate putamen; GP, globus pallidus; SI, substantia innominate; TH, thalamus. b, Basal forebrain stained for inhibitory ChAT (red), axon-GCaMP6s (green), and DAPI (blue). Scale bar, 50 μm. c, Percentage of basal forebrain neurons that express both axon-GCaMP6s and ChAT (black), ChAT-only (red), or axon-GCaMP6s-only (green) (n = 6 animals, 126 cells). Error bars indicate s.e.m.
Extended Data Fig. 2 |. Robust and non-habituating response to multiple complex sounds.
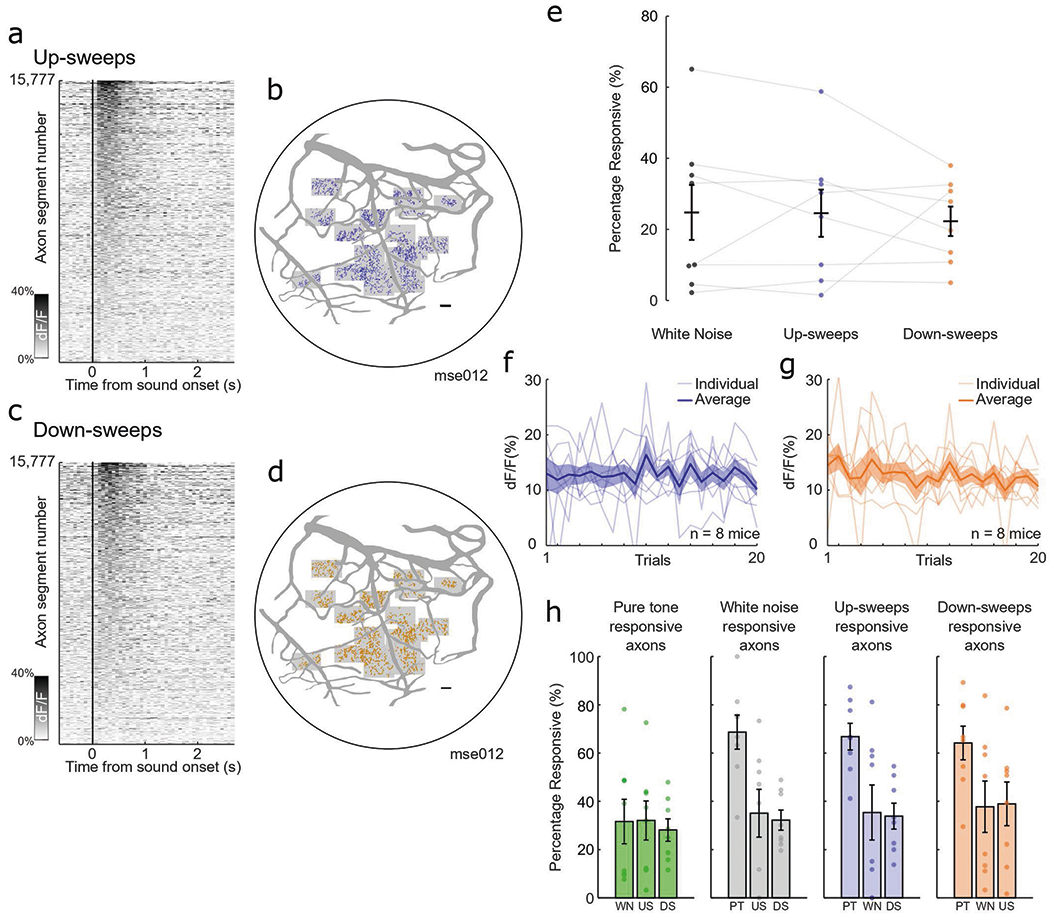
a, Heatmap of average evoked response to up-sweeps for all identified axon segments (n = 15,777). b, Spatial distribution of axon segments responsive to up-sweeps (blue) in one example animal, ‘mse012’. Shaded boxes indicate recording sites. Scale bar, 100 μm. c, Heatmap of average evoked response to down-sweeps for all identified axon segments (n = 15,777). d, Spatial distribution of axon segments responsive to down-sweeps (orange) in one example animal, ‘mse012’. Shaded boxes indicate recording sites. Scale bar, 100 μm. e, Percentage of identified axon segments that are responsive to white noise (black), up-sweeps (blue), and down-sweeps (orange) in eight animals. Error bars indicate s.e.m. f, Amplitude of evoked response for up-sweeps across 20 presentations for all animals. Faded lines indicate individual animals (n = 8 animals) and shaded region indicates s.e.m. g, Amplitude of evoked response for down-sweeps across 20 presentations for all animals. Faded lines indicate individual animals (n = 8 animals) and shaded region indicates s.e.m. h, Axon segments respond to multiple stimuli in all animals (n = 8). Percentage of pure-tone-responsive axons that response to other stimuli (green). Percentage of white-noise-responsive axons that response to other stimuli (gray). Percentage of up-sweep-responsive axons that response to other stimuli (blue). Percentage of down-sweep-responsive axons that response to other stimuli (orange). All data are presented as mean ± s.e.m.
Extended Data Fig. 3 |. Cholinergic axons respond to auditory stimuli at low intensity and after repeated presentation.
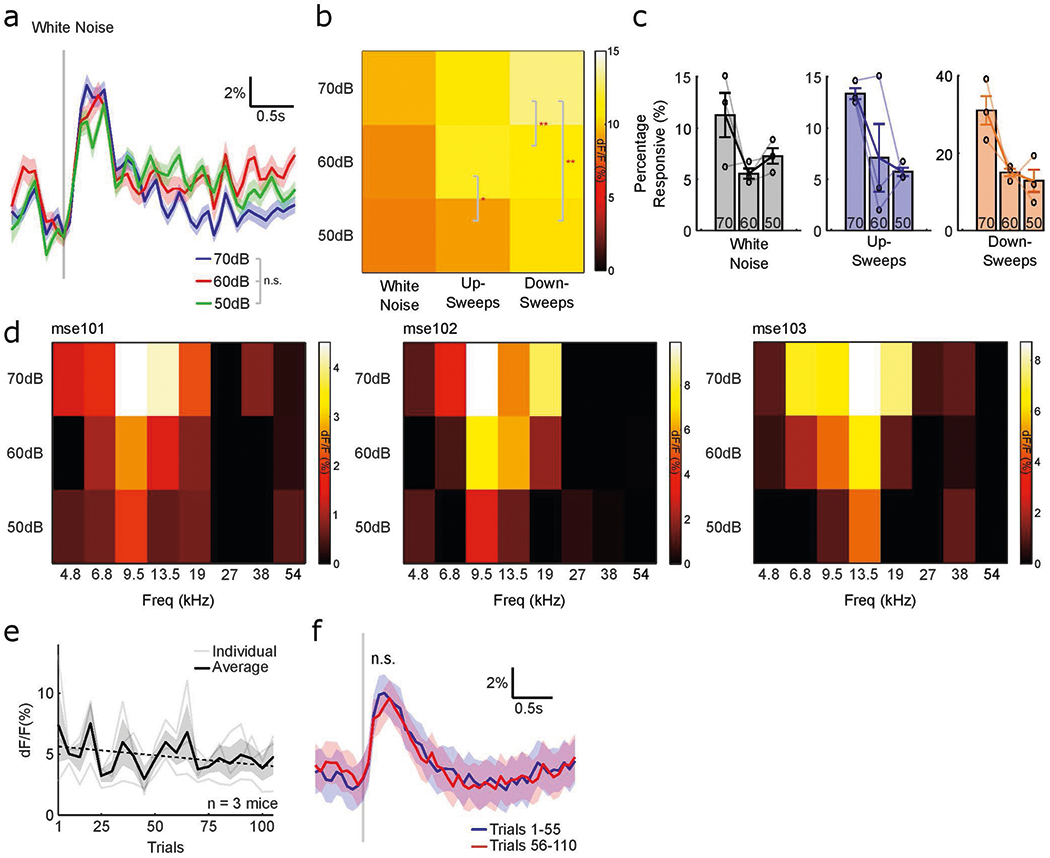
a, Mean fluorescence trace of all responsive axon segments for white noise presented at 70 dB SPL (blue), 60 dB SPL (red), and 50 dB SPL (green) (n = 653 axon segments; F(2,156) = 1.51, P = 0.224, one-way ANOVA). Vertical gray line indicates presentation of white noise and shaded region indicates s.e.m. b, Normalized evoked response to white noise, up-sweeps, and down-sweeps at 50–70 dB SPL. (*P < 0.05, **P < 0.01, one-way ANOVA). c, Proportion of axon segments that responded to white noise, up-sweeps, and down-sweeps at 50–70 dB SPL all animals (n = 3). Error bars indicate s.e.m. d, Normalized evoked response to pure tones at 50–70 dB SPL for 3 animals. e, Amplitude of evoked response for white noise across 110 presentations for all animals (n = 3). Faded lines indicate individual animals and shaded region indicates s.e.m. f, Mean evoked response of all responsive axon segments for 1–55 (blue) and 56–110 (red) presentations of white noise (t(54) = 1.00, P = 0.321, two-tailed paired t-test). Vertical gray line indicates presentation of white noise and shaded region indicates s.e.m.
Extended Data Fig. 4 |. Movements are associated with some but not all phasic cholinergic transients.
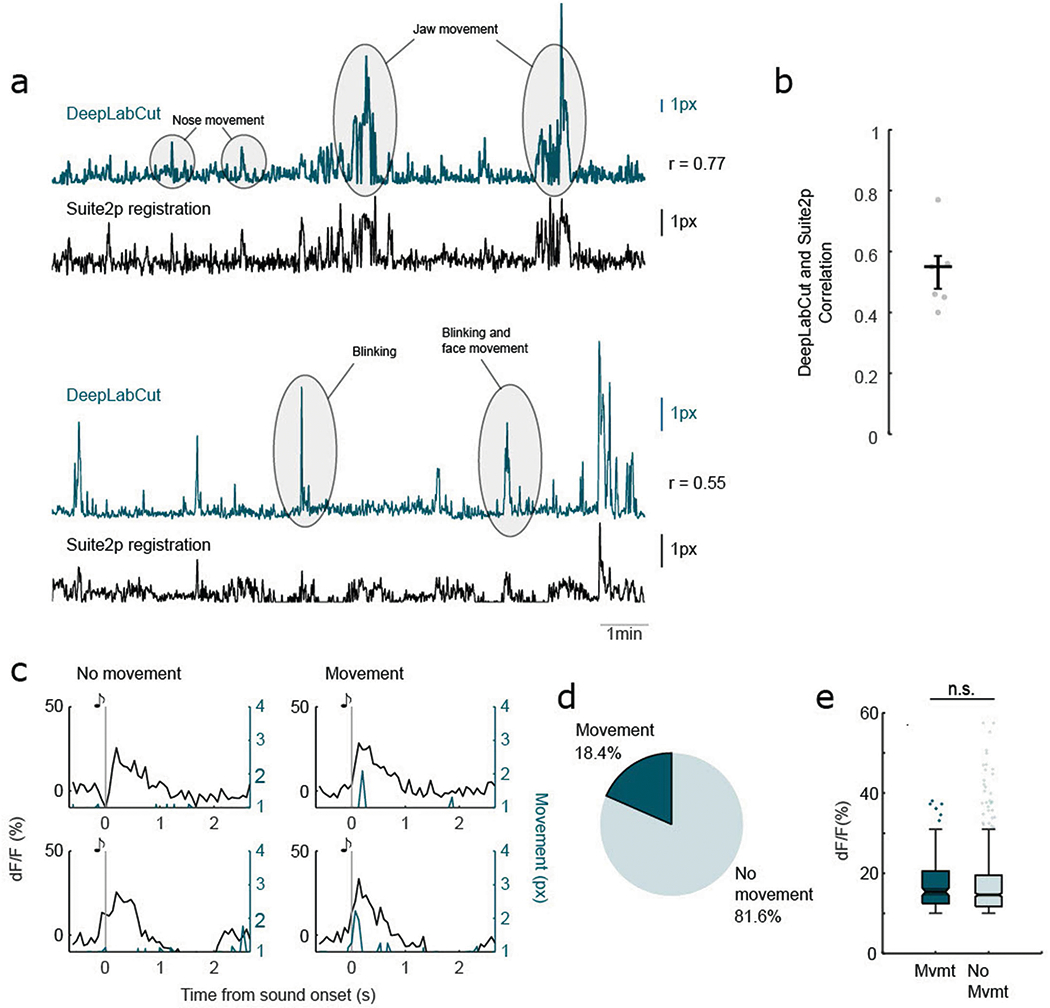
a, Movement signal validation with videography. Example traces of Suite2p-identified x–y offset and videography pose estimation with DeepLabCut. b, Pearson’s correlation between Suite2p-identified x–y offset and videography pose estimation with DeepLabCut in 5 mice. Error bar indicates s.e.m. c, Example stimulus-synchronous phasic cholinergic transients from one example axon segments that are associated with movement (left) and not associated with movement (right). Vertical gray line indicates presentation of the auditory stimulus. d, Percentage of stimulus-synchronous phasic transients that are associated with movements. e, Movement during sound onset does not significantly modulate amplitude of sound-evoked transients. Box plots show median (center line), upper and lower quartiles (boxes), non-outlier maxima and minima (whiskers), and outliers greater than 1.5x interquartile range (points) (n = 179 movement-associated trials, and n = 792 stationary trials; Z = 1.664, P = 0.096, Wilcoxon signed-rank test).
Extended Data Fig. 5 |. Robust stimulus-specific decoding of complex sounds and pure tones.
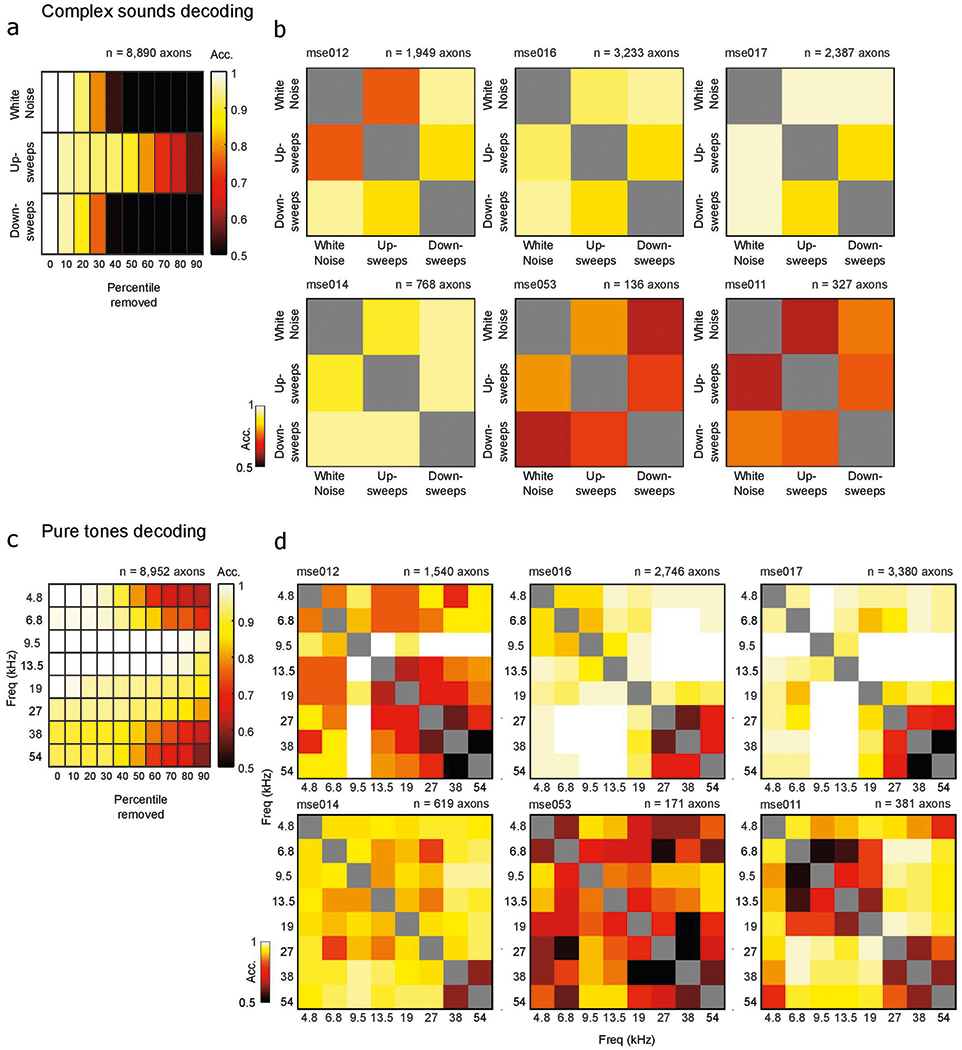
a, Average pairwise decoding accuracy for each complex sound removing nth percentile of most influential ROIs. b, Pairwise decoder accuracy for complex sounds on population activity of responsive axon segments in animals with more than 100 responsive axon segments. All sound-pairs are significantly above chance. c, Average pairwise decoding accuracy for each pure tone removing nth percentile of most influential ROIs. d, Pairwise decoder accuracy for pure tones on population activity of responsive axon segments in animals with more than 100 responsive axon segments. 97.6 ± 0.1% of sound-pairs are significantly above chance.
Extended Data Fig. 6 |. Similarity in tuning between axon segments is not predicted by inter-axon distance.
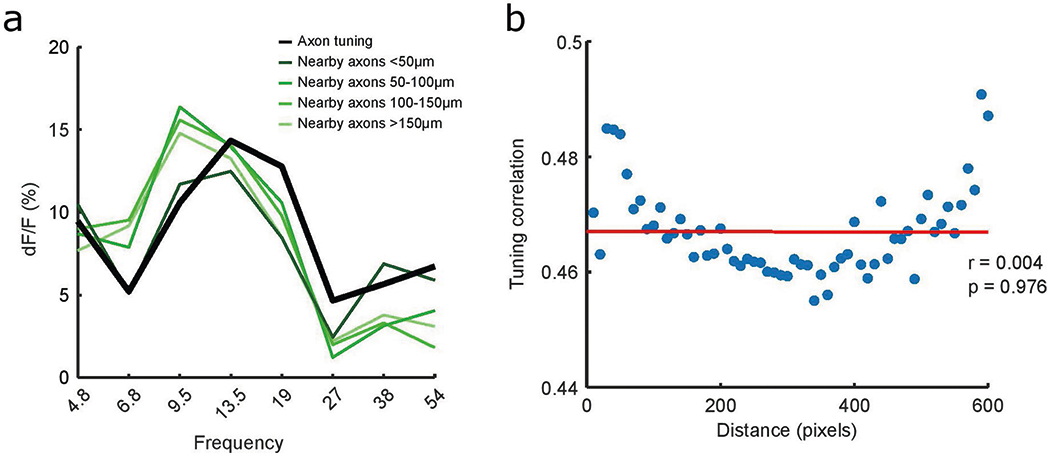
a, Tuning curves of an example axon segment (black) and nearby axon segments (green). b, Pearson’s correlation between inter-axon distance and mean axon tuning correlation at each distance bin (r(59) = −0.004, P = 0.976).
Extended Data Fig. 7 |. Tonotopic gradient of excitatory neurons in primary auditory cortex.

a, Example field-of-view of cortical neurons in primary auditory cortex (left, CaMKII-GCaMP6f) and identified neurons colored by best frequency of cortical neurons (right) in an example animal, ‘mse236’. Analysis was performed on primary auditory cortex in four animals. Scale bar, 50 μm. b, Progression of best frequency of neurons in a along the rostro-caudal axis. Each gray dot indicates the best frequency of a neuron in frequency space (y axis) projected onto the rostro-caudal axis (x axis). Slope of line of best fit (red line) reflects progression of best frequency.
Extended Data Fig. 8 |. Cortical neurons are co-tuned to nearby cortical neurons but un-coupled from nearby cholinergic axons.
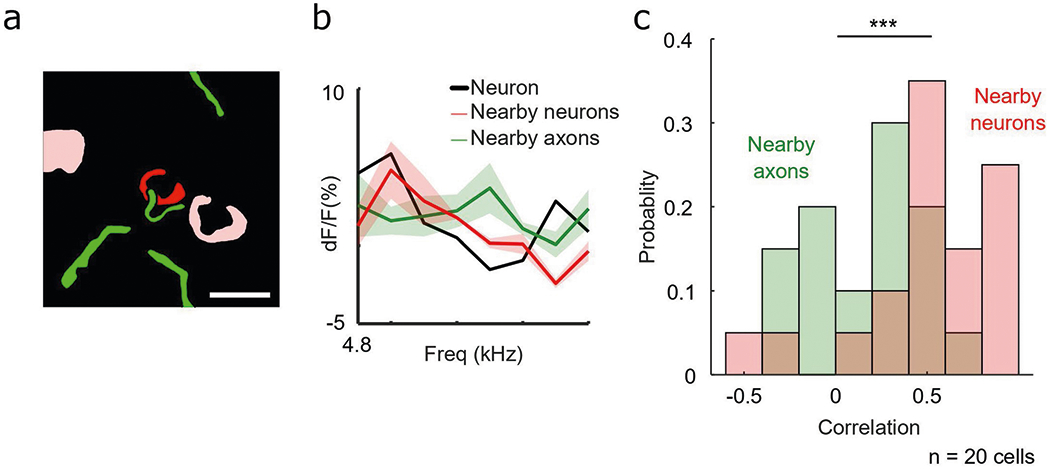
a, Schematic of example neuron (red) and nearby neurons (pink) and responsive axon segments (green). Scale bar, 10 μm. b, Frequency tuning curve of example neuron (black) and nearby neurons (red) and axon segments (green) in a. Shaded region indicates s.e.m. c, Histogram of Pearson’s correlation coefficient between tuning of auditory cortical neurons with nearby cortical neurons (red) and nearby axon segments (green), (D = 0.600, P < 0.001, two-sample Kolmogorov–Smirnov test).
Extended Data Fig. 9 |. Chemogenetic suppression of auditory thalamus and auditory cortex attenuate sound-evoked cortical responses only in animals expressing DREADDs.
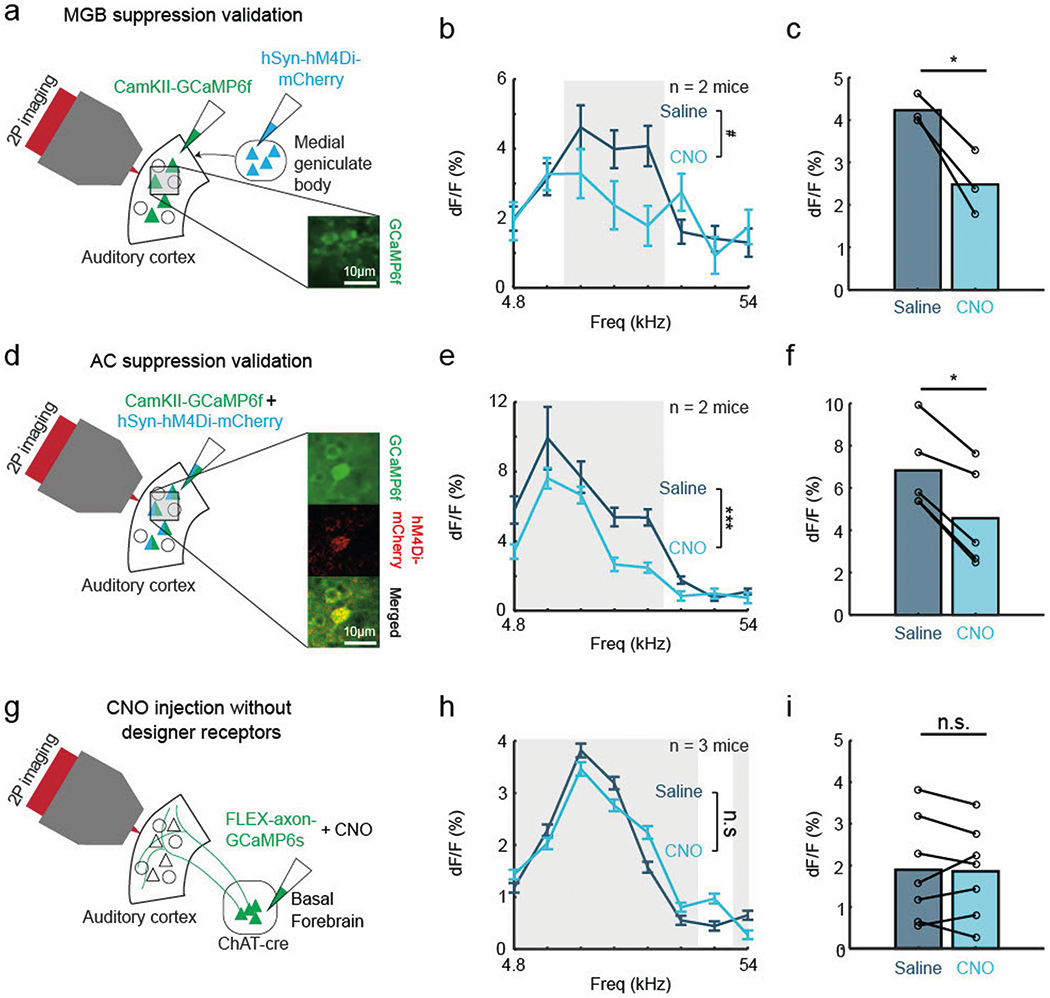
a, Validation of suppression of thalamic activity using chemogenetics. Schematic of injection strategy for suppression of the MGB using hM4Di DREADDs (n = 2 animals). Inset: auditory cortical neurons expressing GCaMP6f (green). b, Evoked cortical response to pure tones after intraperitoneal saline and CNO injection (n = 95 cells for saline condition, n = 55 cells for CNO condition; F(1,1184) = 3.57, P = 0.0589, two-way ANOVA with Tukey’s HSD). Shaded region significantly responsive tones identified post saline injection (9.5–18 kHz). Error bars indicate s.e.m. c, Mean evoked response after intraperitoneal saline and CNO injection for each significantly responsive tone (n = 3 tones; t(2) = 6.12, P < 0.05, two-tailed paired t-test). d, Validation of suppression of cortical activity using chemogenetics. Schematic of injection strategy for suppression of the auditory cortex using hM4Di DREADDs (n = 2 animals). Inset: cortical neurons expressing GCaMP6f (green), inhibitory DREADDs hM4Di (red) and overlaid image. e, Evoked cortical response to pure tones after intraperitoneal saline and CNO injection (n = 232 cells for saline condition, n = 113 cells for CNO condition; F(1,2744) = 13.34, P < 0.001, two-way ANOVA with Tukey’s HSD). Shaded region represents significantly responsive tones identified post saline injection (4.8–19 kHz). Error bars indicate s.e.m. f, Mean evoked response after intraperitoneal saline and CNO injection for each significantly responsive tone (n = 5 tones; t(4) = 6.95, P < 0.01, two-tailed paired t-test). g, Schematic of injection strategy in animals without hM4Di designer receptors (n = 3 animals) h, Evoked cortical response to pure tones after intraperitoneal saline and CNO injection (n = 743 cells for saline condition, n = 664 cells for CNO condition, F(1,11240) = 0.45, P = 0.505, two-way ANOVA with Tukey’s HSD). Shaded region significantly responsive tones identified post saline injection (4.8–27 kHz and 54 kHz). Error bars indicate s.e.m. i, Mean evoked response after intraperitoneal saline and CNO injection for each significantly responsive tone (n = 7 tones; t(6) = 0.219, P = 0.834, two-tailed paired t-test).
Extended Data Fig. 10 |. State-dependent tonic cholinergic activity is coupled with tonic cortical activity and modulates cholinergic response to pure tones and up- and down-sweeps.
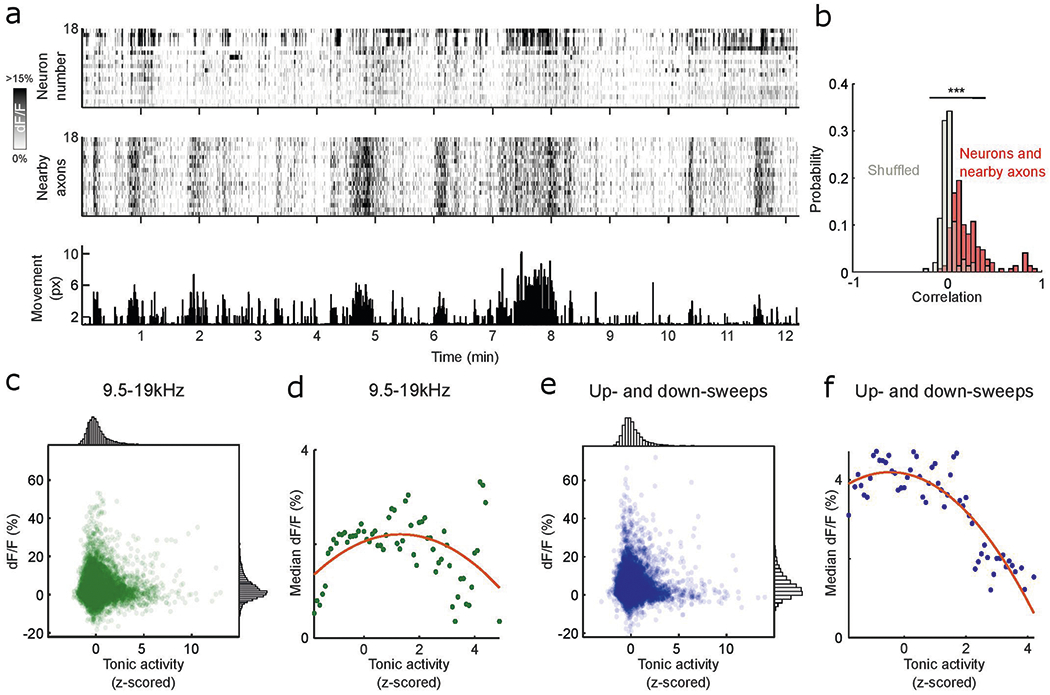
a, Fluorescence activity of neurons in one example recording site (top) and the nearby axons of the respective neurons (middle) and movement of the animal during the recording session (bottom). b, Histogram of Pearson’s correlation coefficient of cell tonic activity and tonic activity of nearby axons (red) compared to shuffled data (gray) (D = 0.718, P < 0.001, two-sample Kolmogorov–Smirnov test). c, Scatterplot of mean evoked response to 9.5–19 kHz at different tonic cholinergic baseline. Histogram for normalized tonic activity (top) and evoked response (right). d, Median evoked response to 9.5–19 kHz across range of tonic activity. Red line indicates best polynomial fit. e, Scatterplot of mean evoked response to up- and down-sweeps at different tonic cholinergic baseline. Histogram for normalized tonic activity (top) and evoked response (right). f, Median evoked response to up- and down-sweeps across range of tonic activity. Red line indicates best polynomial fit.
Supplementary Material
Acknowledgements
We thank C. Connor., R. C. Froemke., C. Honey., D. Lee. and S. P. Mysore for helpful comments on the manuscript and C. Drieu. and Z. Zhu for the assistance with cortical tonotopic measurements. This work was supported by grants from the NIH (grant nos. R01 DC018650, R00DC015014, NSF CAREER 2145247 and BBRF NARSAD to K.V.K.), a JHU Science of Learning Institute Fellowship to F.Z., and by fellowships from the Fondation Fyssen and Kavli Institute to J.L.
Footnotes
Online content
Any methods, additional references, Nature Portfolio reporting summaries, source data, extended data, supplementary information, acknowledgements, peer review information; details of author contributions and competing interests; and statements of data and code availability are available at https://doi.org/10.1038/s41593-023-01289-5.
Competing interests
The authors declare no competing interests.
Extended data is available for this paper at https://doi.org/10.1038/s41593-023-01289-5.
Supplementary information The online version contains supplementary material available at https://doi.org/10.1038/s41593-023-01289-5.
Code availability
Code is available upon request.
Data availability
Data are available upon request.
References
- 1.Mesulam MM, Mufson EJ, Wainer BH & Levey AI Central cholinergic pathways in the rat: an overview based on an alternative nomenclature (Ch1-Ch6). Neuroscience 10, 1185–1201 (1983). [DOI] [PubMed] [Google Scholar]
- 2.Everitt BJ & Robbins TW Central cholinergic systems and cognition. Annu. Rev. Psychol 48, 649–684 (1997). [DOI] [PubMed] [Google Scholar]
- 3.Zaborszky L, Gaykema RP, Swanson DJ & Cullinan WE Cortical input to the basal forebrain. Neuroscience 79, 1051–1078 (1997). [DOI] [PubMed] [Google Scholar]
- 4.Gielow MR & Zaborszky L The input-output relationship of the cholinergic basal forebrain. Cell Rep. 18, 1817–1830 (2017). [DOI] [PMC free article] [PubMed] [Google Scholar]
- 5.Chavez C & Zaborszky L Basal forebrain cholinergic-auditory cortical network: primary versus nonprimary auditory cortical areas. Cereb. Cortex 27, 2335–2347 (2017). [DOI] [PMC free article] [PubMed] [Google Scholar]
- 6.Parikh V, Kozak R, Martinez V & Sarter M Prefrontal acetylcholine release controls cue detection on multiple timescales. Neuron 56, 141–154 (2007). [DOI] [PMC free article] [PubMed] [Google Scholar]
- 7.Lin SC & Nicolelis MAL Neuronal ensemble bursting in the basal forebrain encodes salience irrespective of valence. Neuron 59, 138–149 (2008). [DOI] [PMC free article] [PubMed] [Google Scholar]
- 8.Higley MJ & Picciotto MR Neuromodulation by acetylcholine: examples from schizophrenia and depression. Curr. Opin. Neurobiol 29, 88–95 (2014). [DOI] [PMC free article] [PubMed] [Google Scholar]
- 9.Gritton HJ et al. Cortical cholinergic signaling controls the detection of cues. Proc. Natl Acad. Sci. USA 113, E1089–E1097 (2016). [DOI] [PMC free article] [PubMed] [Google Scholar]
- 10.Sarter M & Lustig C Cholinergic double duty: cue detection and attentional control. Curr. Opin. Psychol 29, 102–107 (2019). [DOI] [PMC free article] [PubMed] [Google Scholar]
- 11.Hasselmo ME The role of acetylcholine in learning and memory. Curr. Opin. Neurobiol 16, 710–715 (2006). [DOI] [PMC free article] [PubMed] [Google Scholar]
- 12.Newman EL, Gupta K, Climer JR, Monaghan CK & Hasselmo ME Cholinergic modulation of cognitive processing: insights drawn from computational models. Front. Behav. Neurosci 6, 1–19 (2012). [DOI] [PMC free article] [PubMed] [Google Scholar]
- 13.Letzkus JJ et al. A disinhibitory microcircuit for associative fear learning in the auditory cortex. Nature 480, 331–335 (2011). [DOI] [PubMed] [Google Scholar]
- 14.Ballinger EC, Ananth M, Talmage DA & Role LW Basal forebrain cholinergic circuits and signaling in cognition and cognitive decline. Neuron 91, 1199–1218 (2016). [DOI] [PMC free article] [PubMed] [Google Scholar]
- 15.Maurer SV & Williams CL The cholinergic system modulates memory and hippocampal plasticity via its interactions with non-neuronal cells. Front. Immunol 8, 1489 (2017). [DOI] [PMC free article] [PubMed] [Google Scholar]
- 16.Bakin JS & Weinberger NM Induction of a physiological memory in the cerebral cortex by stimulation of the nucleus basalis. Proc. Natl Acad. Sci. USA 93, 11219–11224 (1996). [DOI] [PMC free article] [PubMed] [Google Scholar]
- 17.Kilgard MP & Merzenich MM Cortical map reorganization enabled by nucleus basalis activity. Science 279, 1714–1718 (1998). [DOI] [PubMed] [Google Scholar]
- 18.Froemke RC, Merzenich MM & Schreiner CE A synaptic memory trace for cortical receptive field plasticity. Nature 450, 425–429 (2007). [DOI] [PubMed] [Google Scholar]
- 19.Froemke RC et al. Long-term modification of cortical synapses improves sensory perception. Nat. Neurosci 16, 79–88 (2013). [DOI] [PMC free article] [PubMed] [Google Scholar]
- 20.Takesian AE, Bogart LJ, Lichtman JW & Hensch TK Inhibitory circuit gating of auditory critical-period plasticity. Nat. Neurosci 21, 218–227 (2018). [DOI] [PMC free article] [PubMed] [Google Scholar]
- 21.Sarter M, Lustig C, Howe WM, Gritton H & Berry AS Deterministic functions of cortical acetylcholine. Eur. J. Neurosci 39, 1912–1920 (2014). [DOI] [PMC free article] [PubMed] [Google Scholar]
- 22.Disney AA & Higley MJ Diverse spatiotemporal scales of cholinergic signaling in the neocortex. J. Neurosci 40, 720–725 (2020). [DOI] [PMC free article] [PubMed] [Google Scholar]
- 23.Sarter M & Lustig C Forebrain cholinergic signaling: wired and phasic, not tonic, and causing behavior. J. Neurosci 40, 712–719 (2020). [DOI] [PMC free article] [PubMed] [Google Scholar]
- 24.Zaborszky L, van den Pol A & Gyengesi E in The Mouse Nervous System (eds Watson C, Paxinos G, & Puelles L) 684–718 (Elsevier, 2012). [Google Scholar]
- 25.Do JP et al. Cell type-specific long-range connections of basal forebrain circuit. eLife 5, e13214 (2016). [DOI] [PMC free article] [PubMed] [Google Scholar]
- 26.Hu R, Jin S, He X, Xu F & Hu J Whole-brain monosynaptic afferent inputs to basal forebrain cholinergic system. Front. Neuroanat 10, 98 (2016). [DOI] [PMC free article] [PubMed] [Google Scholar]
- 27.Buzsaki G. et al. Nucleus basalis and thalamic control of neocortical activity in the freely moving rat. J. Neurosci 8, 4007–4026 (1988). [DOI] [PMC free article] [PubMed] [Google Scholar]
- 28.McGinley MJ et al. Waking state: rapid variations modulate neural and behavioral responses. Neuron 87, 1143–1161 (2015). [DOI] [PMC free article] [PubMed] [Google Scholar]
- 29.Reimer J. et al. Pupil fluctuations track rapid changes in adrenergic and cholinergic activity in cortex. Nat. Commun 7, 13289 (2016). [DOI] [PMC free article] [PubMed] [Google Scholar]
- 30.Kuchibhotla KV et al. Parallel processing by cortical inhibition enables context-dependent behavior. Nat. Neurosci 20, 62–71 (2017). [DOI] [PMC free article] [PubMed] [Google Scholar]
- 31.Teles-Grilo Ruivo LM et al. Coordinated acetylcholine release in prefrontal cortex and hippocampus is associated with arousal and reward on distinct timescales. Cell Rep. 18, 905–917 (2017). [DOI] [PMC free article] [PubMed] [Google Scholar]
- 32.Lohani S. et al. Spatiotemporally heterogeneous coordination of cholinergic and neocortical activity. Nat. Neurosci 25, 1706–1713 (2022). [DOI] [PMC free article] [PubMed] [Google Scholar]
- 33.Hangya B, Ranade SP, Lorenc M & Kepecs A Central cholinergic neurons are rapidly recruited by reinforcement feedback. Cell 162, 1155–1168 (2015). [DOI] [PMC free article] [PubMed] [Google Scholar]
- 34.Harrison TC, Pinto L, Brock JR & Dan Y Calcium imaging of basal forebrain activity during innate and learned behaviors. Front. Neural Circuits 10, 36 (2016). [DOI] [PMC free article] [PubMed] [Google Scholar]
- 35.Crouse RB et al. Acetylcholine is released in the basolateral amygdala in response to predictors of reward and enhances the learning of cue-reward contingency. eLife 9, e57335 (2020). [DOI] [PMC free article] [PubMed] [Google Scholar]
- 36.Sturgill JF et al. Basal forebrain-derived acetylcholine encodes valence-free reinforcement prediction error. Preprint at bioRxiv (2020). 10.1101/2020.02.17.953141v1 [DOI]
- 37.Pinto L. et al. Fast modulation of visual perception by basal forebrain cholinergic neurons. Nat. Neurosci 16, 1857–1863 (2013). [DOI] [PMC free article] [PubMed] [Google Scholar]
- 38.Eggermann E, Kremer Y, Crochet S & Petersen CCH Cholinergic signals in mouse barrel cortex during active whisker sensing. Cell Rep. 9, 1654–1660 (2014). [DOI] [PubMed] [Google Scholar]
- 39.Nelson A & Mooney R The basal forebrain and motor cortex provide convergent yet distinct movement-related inputs to the auditory cortex. Neuron 90, 635–648 (2016). [DOI] [PMC free article] [PubMed] [Google Scholar]
- 40.Guo W, Robert B & Polley DB The cholinergic basal forebrain links auditory stimuli with delayed reinforcement to support learning. Neuron 103, 1164–1177.e6 (2019). [DOI] [PMC free article] [PubMed] [Google Scholar]
- 41.Robert B. et al. A functional topography within the cholinergic basal forebrain for encoding sensory cues and behavioral reinforcement outcomes. eLife 10, e69514 (2021). [DOI] [PMC free article] [PubMed] [Google Scholar]
- 42.Kim JH et al. Selectivity of neuromodulatory projections from the basal forebrain and locus ceruleus to primary sensory cortices. J. Neurosci 36, 5314–5327 (2016). [DOI] [PMC free article] [PubMed] [Google Scholar]
- 43.Zhang K, Chen CD & Monosov IE Novelty, salience, and surprise timing are signaled by neurons in the basal forebrain. Curr. Biol 29, 134–142.e3 (2019). [DOI] [PMC free article] [PubMed] [Google Scholar]
- 44.Betzel RF, Wood KC, Angeloni C, Geffen MN & Bassett DS Stability of spontaneous, correlated activity in mouse auditory cortex. PLoS Comput. Biol 15, e1007360 (2019). [DOI] [PMC free article] [PubMed] [Google Scholar]
- 45.Kohn A, Coen-Cagli R, Kanitscheider I & Pouget A Correlations and neuronal population information. Annu. Rev. Neurosci 39, 237–256 (2016). [DOI] [PMC free article] [PubMed] [Google Scholar]
- 46.Stiebler I, Neulist R, Fichtel I & Ehret G The auditory cortex of the house mouse: left-right differences, tonotopic organization and quantitative analysis of frequency representation. J. Comp. Physiol. A 181, 559–571 (1997). [DOI] [PubMed] [Google Scholar]
- 47.Hackett TA, Barkat TR, O’Brien BMJ, Hensch TK & Polley DB Linking topography to tonotopy in the mouse auditory thalamocortical circuit. J. Neurosci 31, 2983–2995 (2011). [DOI] [PMC free article] [PubMed] [Google Scholar]
- 48.Bloem B. et al. Topographic mapping between basal forebrain cholinergic neurons and the medial prefrontal cortex in mice. J. Neurosci 34, 16234–16246 (2014). [DOI] [PMC free article] [PubMed] [Google Scholar]
- 49.Mechawar N, Cozzari C & Descarries L Cholinergic innervation in adult rat cerebral cortex: a quantitative immunocytochemical description. J. Comp. Neurol 428, 305–318 (2000). [DOI] [PubMed] [Google Scholar]
- 50.Obermayer J, Verhoog MB, Luchicchi A & Mansvelder HD Cholinergic modulation of cortical microcircuits is layer-specific: evidence from rodent, monkey and human brain. Front. Neural Circuits 11, 1–12 (2017). [DOI] [PMC free article] [PubMed] [Google Scholar]
- 51.Hasselmo ME & Sarter M Modes and models of forebrain cholinergic neuromodulation of cognition. Neuropsychopharmacology 36, 52–73 (2011). [DOI] [PMC free article] [PubMed] [Google Scholar]
- 52.Turner JG, Parrish JL, Hughes LF, Toth LA & Caspary DM Hearing in laboratory animals: strain differences and nonauditory effects of noise. Comp. Med 55, 12–23 (2005). [PMC free article] [PubMed] [Google Scholar]
- 53.Reynolds RP, Kinard WL, Degraff JJ, Leverage N & Norton JN Noise in a laboratory animal facility from the human and mouse perspectives. J. Am. Assoc. Lab. Anim. Sci 49, 592–597 (2010). [PMC free article] [PubMed] [Google Scholar]
- 54.Laszlovszky T. et al. Distinct synchronization, cortical coupling and behavioral function of two basal forebrain cholinergic neuron types. Nat. Neurosci 23, 992–1003 (2020). [DOI] [PMC free article] [PubMed] [Google Scholar]
- 55.Yerkes RM & Dodson JD The relation of strength of stimulus to rapidity of habit-formation. J. Comp. Neurol. Psychol 18, 459–482 (1908). [Google Scholar]
- 56.Dana H. et al. Sensitive red protein calcium indicators for imaging neural activity. eLife 5, e12727 (2016). [DOI] [PMC free article] [PubMed] [Google Scholar]
- 57.Pachitariu M. et al. Suite2p: beyond 10,000 neurons with standard two-photon microscopy. Preprint at bioRxiv (2016). 10.1101/061507v2 [DOI] [Google Scholar]
- 58.Bandyopadhyay S, Shamma SA & Kanold PO Dichotomy of functional organization in the mouse auditory cortex. Nat. Neurosci 13, 361–368 (2010). [DOI] [PMC free article] [PubMed] [Google Scholar]
- 59.Mathis A. et al. DeepLabCut: markerless pose estimation of user-defined body parts with deep learning. Nat. Neurosci 21, 1281–1289 (2018). [DOI] [PubMed] [Google Scholar]
- 60.Lovett-Barron M. et al. Dendritic inhibition in the hippocampus supports fear learning. Science 343, 857–863 (2014). [DOI] [PMC free article] [PubMed] [Google Scholar]
Associated Data
This section collects any data citations, data availability statements, or supplementary materials included in this article.
Supplementary Materials
Data Availability Statement
Data are available upon request.


