
Extended Data Fig. 9 |. Chemogenetic suppression of auditory thalamus and auditory cortex attenuate sound-evoked cortical responses only in animals expressing DREADDs.
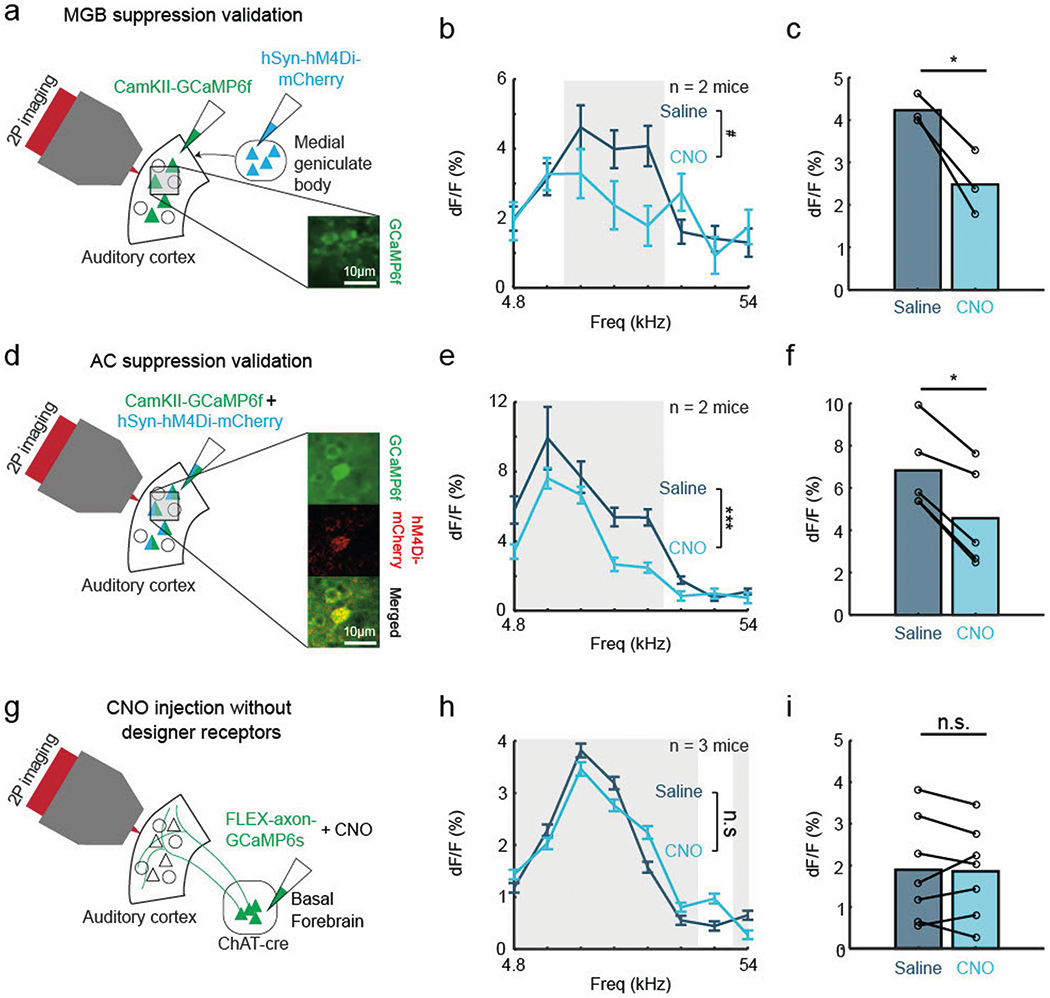
a, Validation of suppression of thalamic activity using chemogenetics. Schematic of injection strategy for suppression of the MGB using hM4Di DREADDs (n = 2 animals). Inset: auditory cortical neurons expressing GCaMP6f (green). b, Evoked cortical response to pure tones after intraperitoneal saline and CNO injection (n = 95 cells for saline condition, n = 55 cells for CNO condition; F(1,1184) = 3.57, P = 0.0589, two-way ANOVA with Tukey’s HSD). Shaded region significantly responsive tones identified post saline injection (9.5–18 kHz). Error bars indicate s.e.m. c, Mean evoked response after intraperitoneal saline and CNO injection for each significantly responsive tone (n = 3 tones; t(2) = 6.12, P < 0.05, two-tailed paired t-test). d, Validation of suppression of cortical activity using chemogenetics. Schematic of injection strategy for suppression of the auditory cortex using hM4Di DREADDs (n = 2 animals). Inset: cortical neurons expressing GCaMP6f (green), inhibitory DREADDs hM4Di (red) and overlaid image. e, Evoked cortical response to pure tones after intraperitoneal saline and CNO injection (n = 232 cells for saline condition, n = 113 cells for CNO condition; F(1,2744) = 13.34, P < 0.001, two-way ANOVA with Tukey’s HSD). Shaded region represents significantly responsive tones identified post saline injection (4.8–19 kHz). Error bars indicate s.e.m. f, Mean evoked response after intraperitoneal saline and CNO injection for each significantly responsive tone (n = 5 tones; t(4) = 6.95, P < 0.01, two-tailed paired t-test). g, Schematic of injection strategy in animals without hM4Di designer receptors (n = 3 animals) h, Evoked cortical response to pure tones after intraperitoneal saline and CNO injection (n = 743 cells for saline condition, n = 664 cells for CNO condition, F(1,11240) = 0.45, P = 0.505, two-way ANOVA with Tukey’s HSD). Shaded region significantly responsive tones identified post saline injection (4.8–27 kHz and 54 kHz). Error bars indicate s.e.m. i, Mean evoked response after intraperitoneal saline and CNO injection for each significantly responsive tone (n = 7 tones; t(6) = 0.219, P = 0.834, two-tailed paired t-test).