
Fig. 5 |. State-dependent tonic cholinergic activity modulates sound-evoked cholinergic responses.
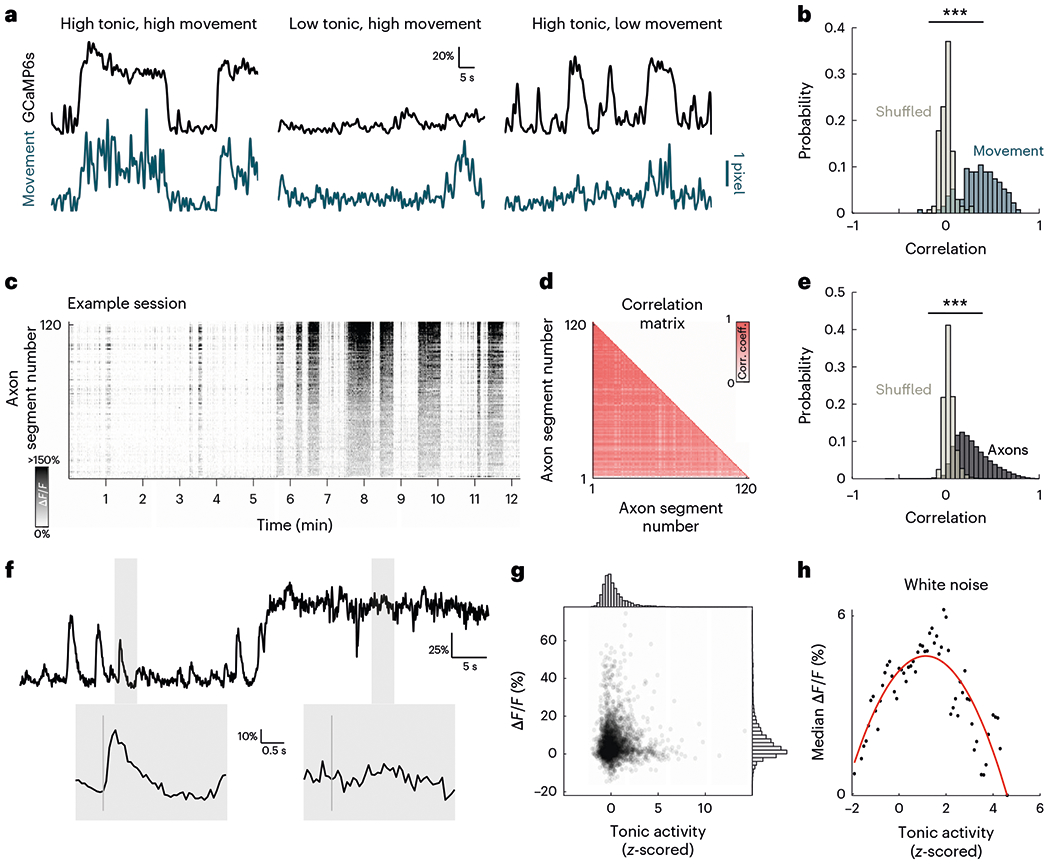
a, Example tonic GCaMP6s fluorescence activity (black) and movement (turquoise). Some high-tonic epochs are associated with movement (left), some movements are not associated with high-tonic epochs (center) and some high-tonic epochs are not associated with movement (right). Scale bar indicates 1-pixel movement. b, Histogram of Pearson’s correlation coefficient of GCaMP6s signal and movement (turquoise) compared with shuffled data (gray) (D = 0.837, P < 0.001, two-sample Kolmogorov–Smirnov test). c, Tonic GCaMP6s signal for all axon segments in example recording site. d, Correlation matrix of tonic activity for all segments in c. e, Histogram of Pearson’s correlation coefficient of axon segments in each recording site (black) compared with shuffled data (gray) (D = 0.727, P < 0.001, two-sample Kolmogorov–Smirnov test). f, Top, example mean fluorescence activity of one recording session showing low and high tonic activity. Shaded regions indicate response windows to white noise. Bottom, evoked response to white noise at low and high tonic activity corresponding to windows highlighted above. Vertical gray line indicates presentation of white noise. g, Scatterplot of mean evoked response to white noise at different tonic cholinergic baselines. Histogram for normalized tonic activity (top) and evoked response (right). h, Median evoked response to white noise across a range of tonic activity. Red line indicates best polynomial fit. Corr. coeff., correlation coefficient; Freq, frequency.