
Extended Data Fig. 3 |. Cholinergic axons respond to auditory stimuli at low intensity and after repeated presentation.
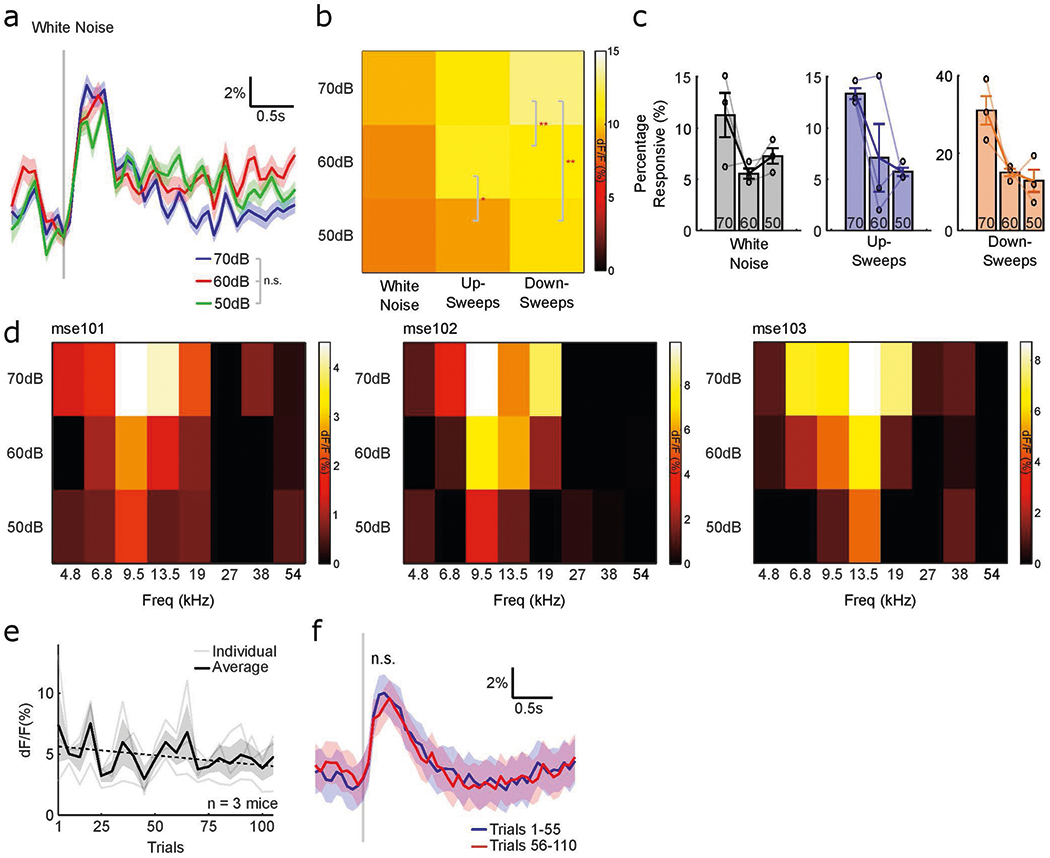
a, Mean fluorescence trace of all responsive axon segments for white noise presented at 70 dB SPL (blue), 60 dB SPL (red), and 50 dB SPL (green) (n = 653 axon segments; F(2,156) = 1.51, P = 0.224, one-way ANOVA). Vertical gray line indicates presentation of white noise and shaded region indicates s.e.m. b, Normalized evoked response to white noise, up-sweeps, and down-sweeps at 50–70 dB SPL. (*P < 0.05, **P < 0.01, one-way ANOVA). c, Proportion of axon segments that responded to white noise, up-sweeps, and down-sweeps at 50–70 dB SPL all animals (n = 3). Error bars indicate s.e.m. d, Normalized evoked response to pure tones at 50–70 dB SPL for 3 animals. e, Amplitude of evoked response for white noise across 110 presentations for all animals (n = 3). Faded lines indicate individual animals and shaded region indicates s.e.m. f, Mean evoked response of all responsive axon segments for 1–55 (blue) and 56–110 (red) presentations of white noise (t(54) = 1.00, P = 0.321, two-tailed paired t-test). Vertical gray line indicates presentation of white noise and shaded region indicates s.e.m.