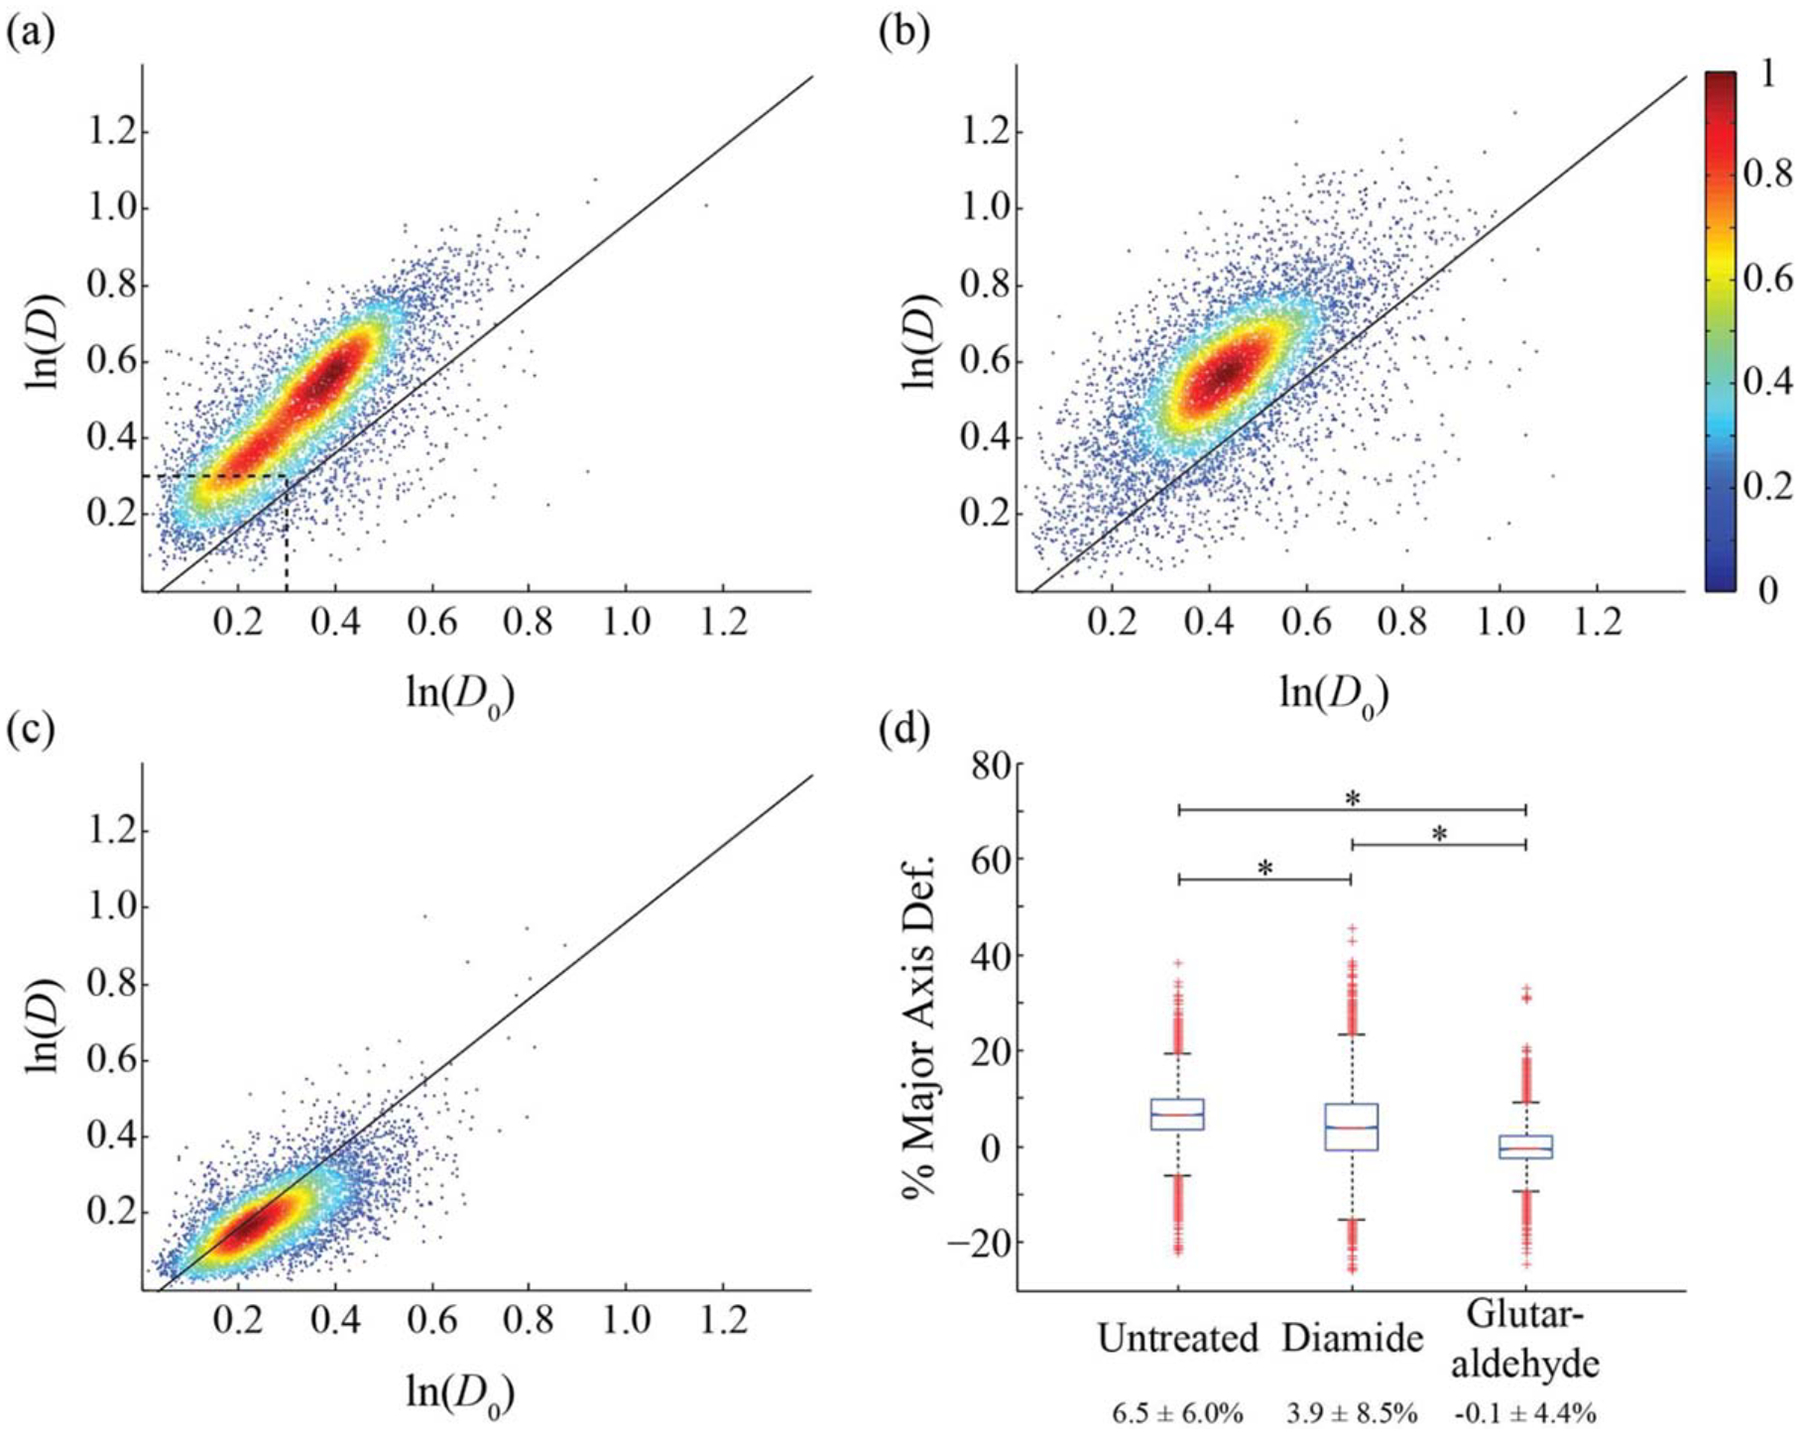
Figure 3.

Cell aspect ratio for pure RBCs. D corresponds to the ratio of the cell’s major and minor axis diameters at the end of the optical stretcher, D0 represents the same ratio 30 μm down the flow channel. (a) Untreated (n = 8,098), (b) treated with 3.8 mM diamide (n = 7,917), (c) treated with 0.05% vol/vol glutaraldehyde (n = 5,883). Solid lines correspond to measurements on rigid colloids. (d) Box plot of the average percent deformation of the major axis with average values and standard deviations from data in panels (a–c). (*) corresponds to a P values of 10−4 for a two-sample t test. The color bar shows a scale for the normalized population density. The dashed line in (a) identifies the location of the neutrophil population in Figure 4a.
