Figure 3.

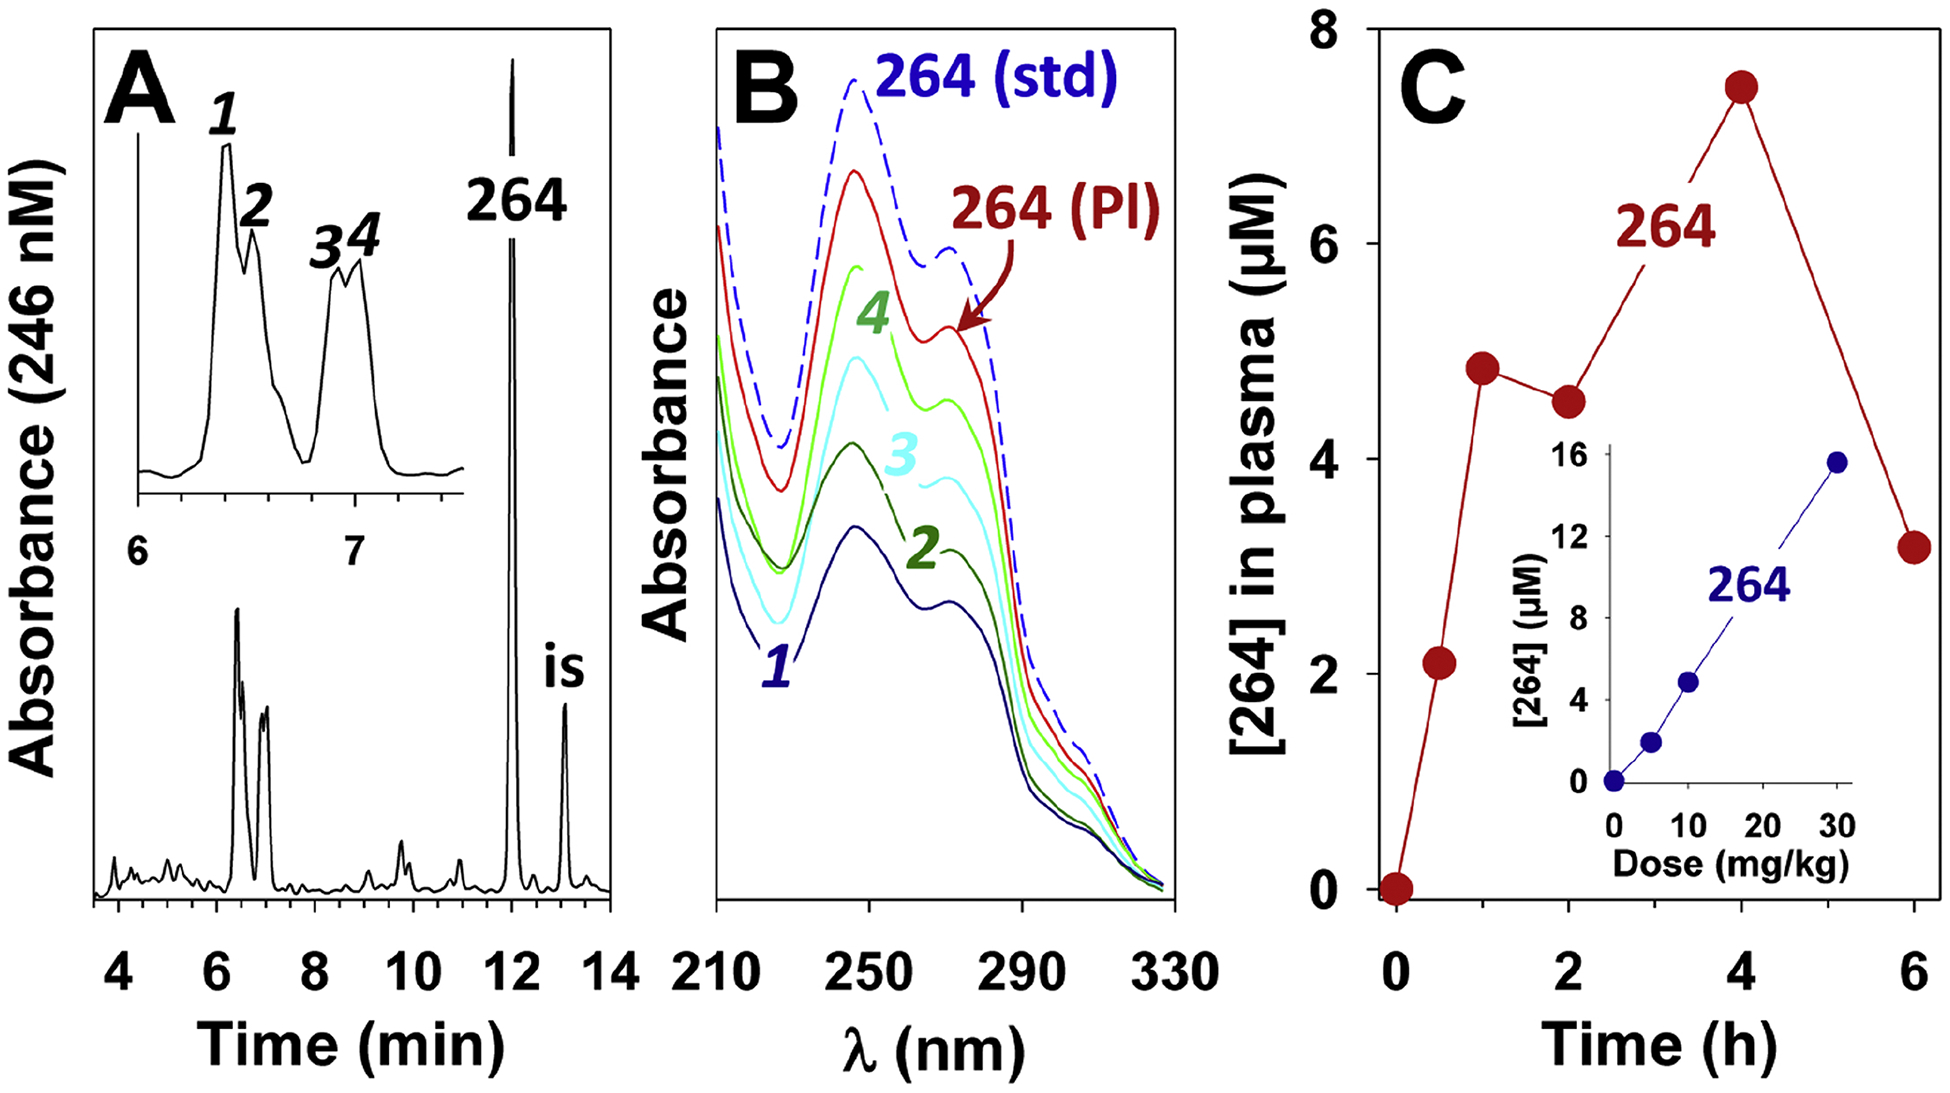
Metabolism and pharmacokinetics of 264 in rats. 264 was administered by oral gavage to rats as described in the Methods section. The rats were sacrificed after different times and plasma samples were analyzed by RP-HPLC on a Novapak C18 column following solid-phase extraction using 190 as an internal standard (is) as described in Methods. A: Chromatogram of an extract of plasma obtained 4 h after administration of 264 (10 mg/kg). The region containing metabolites 1–4 is expanded in the inset. B: UV spectra of metabolites 1–4 from panel A along with the peak labeled “264” in panel A (264 (Pl)) and authentic 264. C: Plasma levels of 264 after oral administration of a dose of 10 mg/kg (●). The inset shows the plasma levels of 264 (●) 1 h after administration of doses of 5, 10, and 30 mg/kg. Each point represents a single rat (blood was taken only once at the time the animal was sacrificed).
