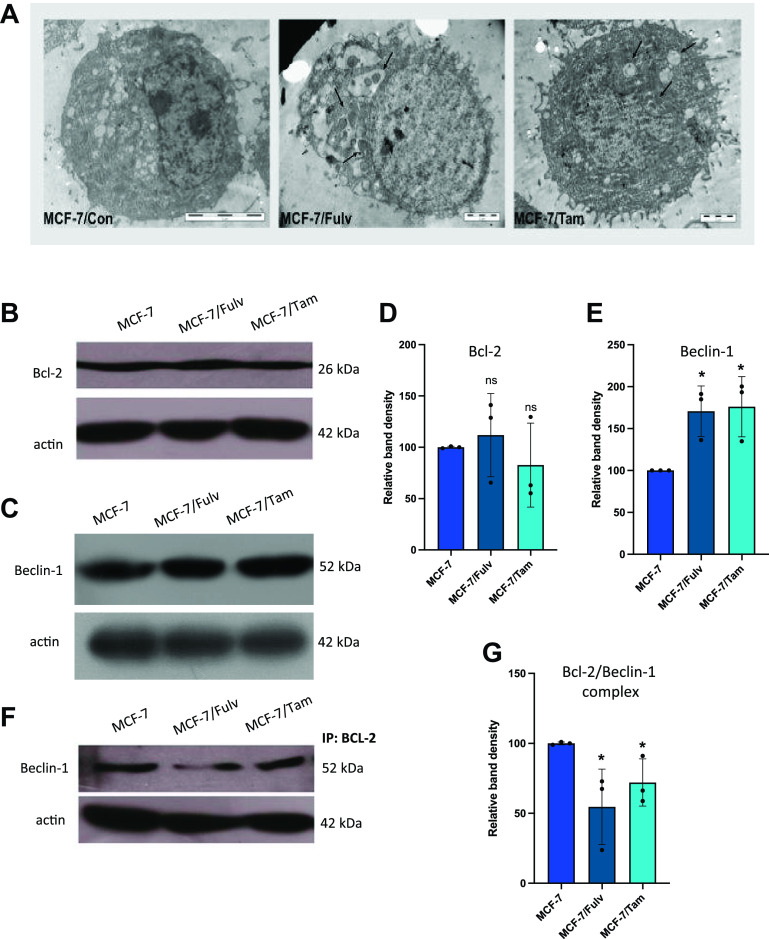
Figure 6.
A: transmission electron microscopy (TEM) analysis indicating autophagosomes in parental MCF-7 cells and hormone-resistant MCF-7 cells resistant to fulvestrant (MCF-7/Fulv) and MCF-7 cells resistant to tamoxifen (MCF-7/Tam). Protein expression levels of Bcl-2 (B and D) and Beclin-1 (C and E) were determined by immunoblotting and quantified. Immunoprecipitation with antibody against Bcl-2 and identification of interacting Beclin-1 protein levels with immunoblotting (F and G). The density of immunoreactive bands was analyzed using ImageJ Software followed by normalization to the loading control (actin), and a percentage relative to the control MCF-7 cells was obtained. Results are expressed as mean ± SD of % change of relative band density of three independent experiments. *Statistically significant differences (P ≤ 0.05) compared with control parental MCF-7 cells.

