
Figure 3.
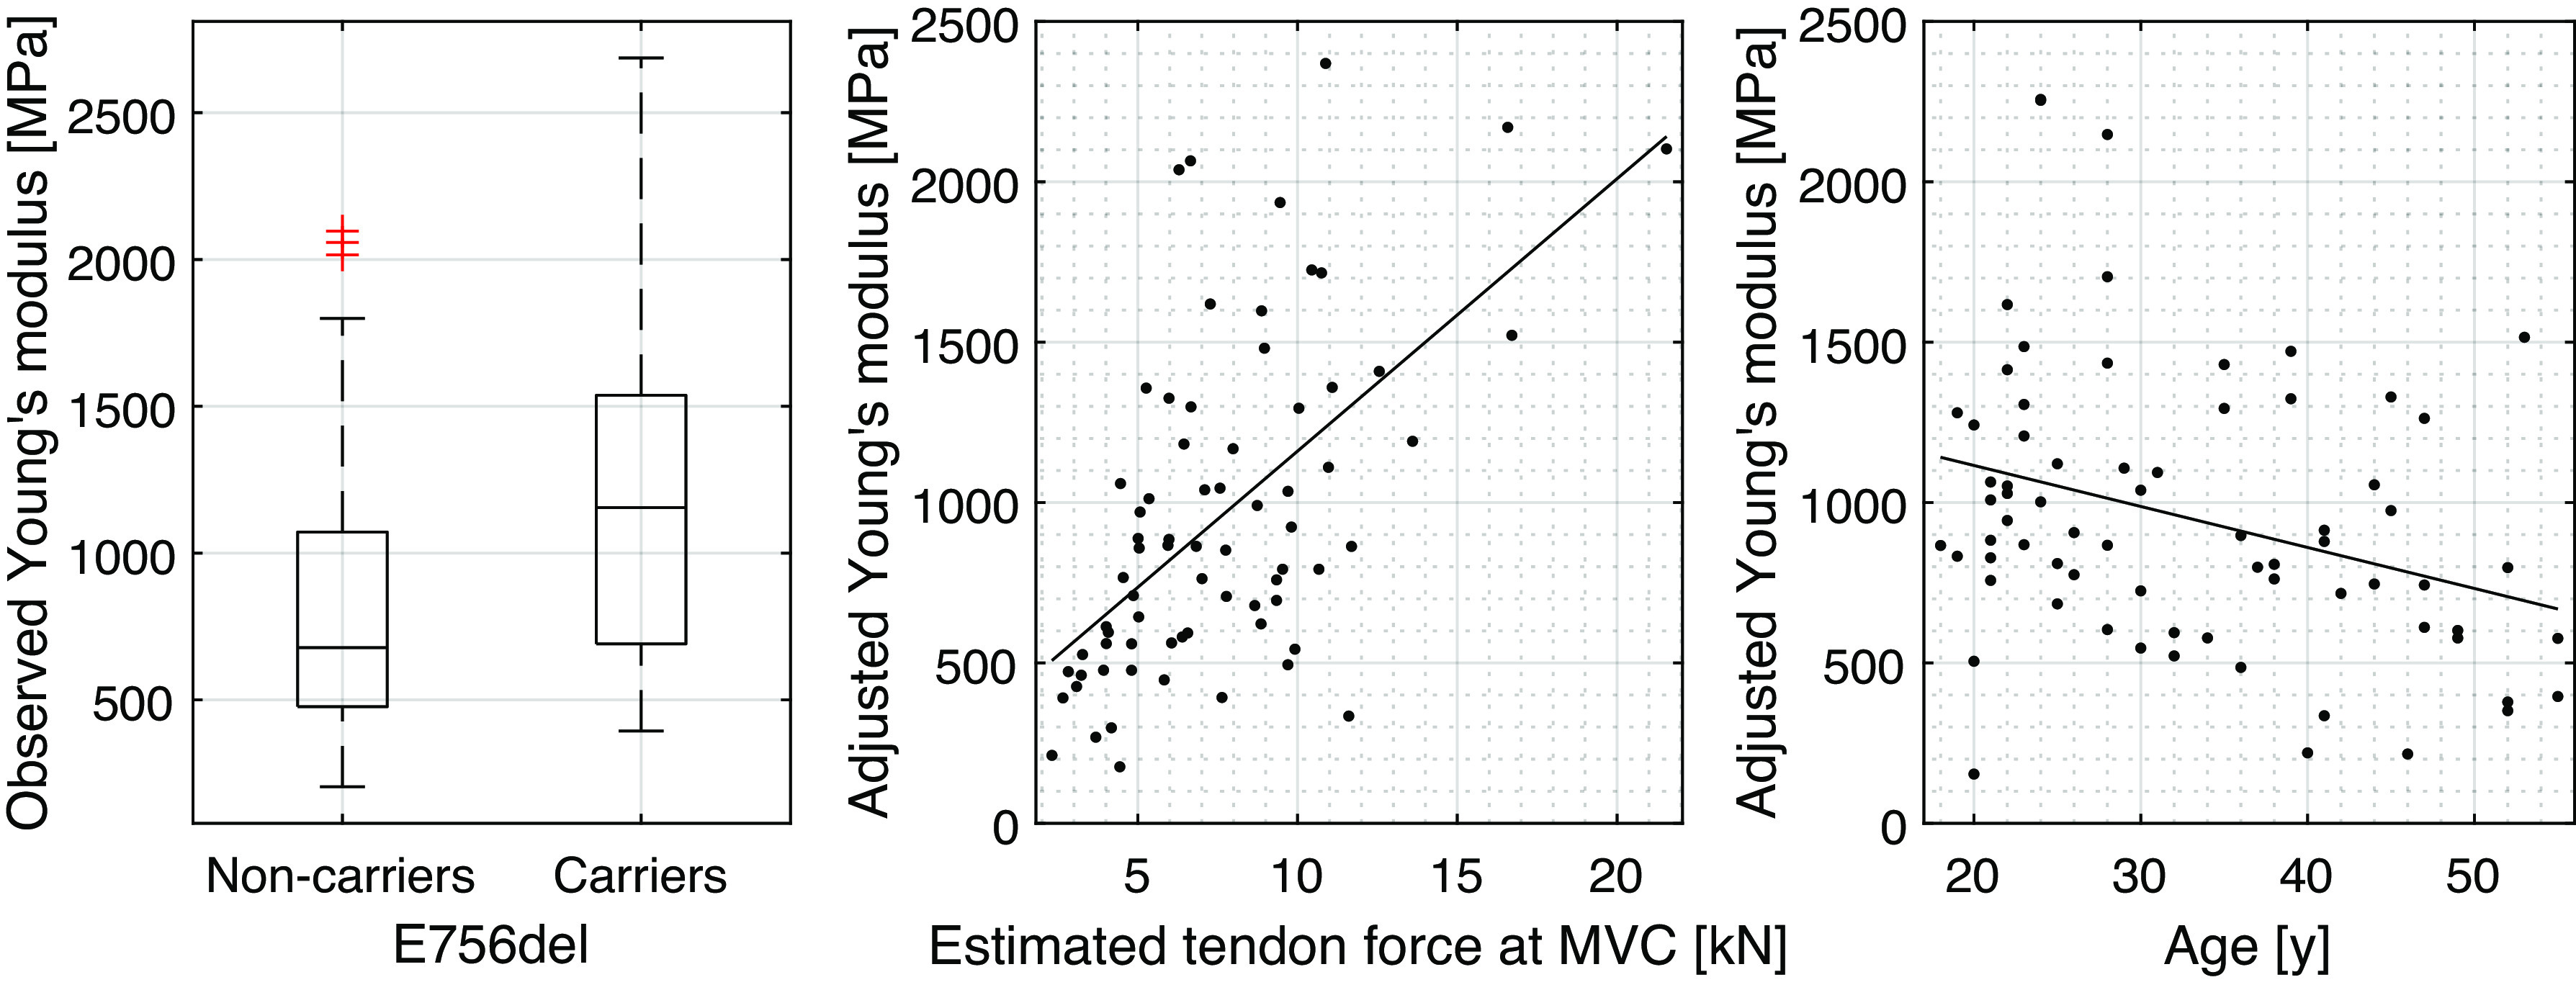
Patellar tendon Young’s modulus as a function of the two investigated groups, estimated tendon force at maximum voluntary contraction (MVC) and subject age. In the scatterplots the response variable is adjusted for the influence of the predictors not included in the respective plot as estimated based on the linear inference model presented in Table 5. Tendon-force and age-associated fits are represented with solid lines.