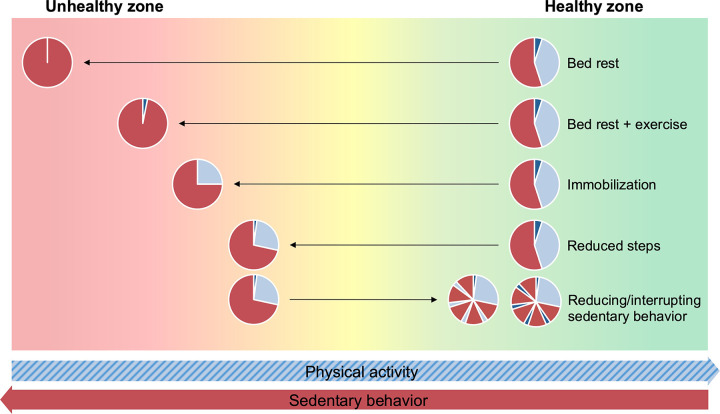
FIGURE 2.
Hypothetical representation of imposed changes in physical activity level by experimental models that can induce changes in time spent in sedentary behavior. Fluctuations in physical activity levels, such as those imposed by these experimental models, may result in increased or decreased risk of adverse health outcomes. For the pie charts, red represents sedentary behavior, light blue represents standing and light-intensity physical activity, and dark blue represents moderate-to-vigorous intensity physical activity. Horizontal arrows schematically represent the direction of changes in physical activity and sedentary behavior. Image was created with mindthegraph.com, with permission.

