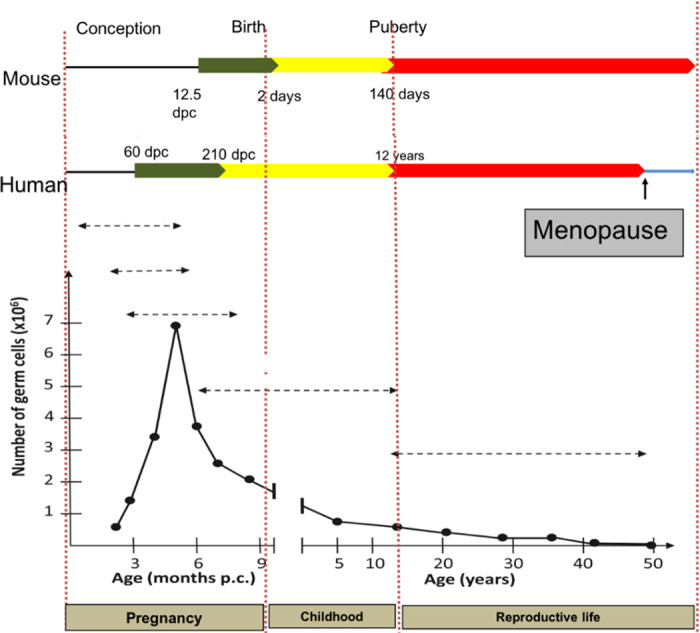
FIGURE 2.

Numbers and timings of oocyte formation and loss. Outline of timings (dpc, days postconception) of follicle formation in mouse and human (green) with graph depicting numbers of germ cells and rate of loss prepubertally (yellow) and until menopause (red). Only 0.1% of follicles will ever be ovulated with the rest degenerating at different stages. Image created with BioRender.com, with permission.
